Immigrants from Colombia vs Bhutanese Poverty
COMPARE
Immigrants from Colombia
Bhutanese
Poverty
Poverty Comparison
Immigrants from Colombia
Bhutanese
12.3%
POVERTY
47.7/ 100
METRIC RATING
176th/ 347
METRIC RANK
10.4%
POVERTY
99.8/ 100
METRIC RATING
12th/ 347
METRIC RANK
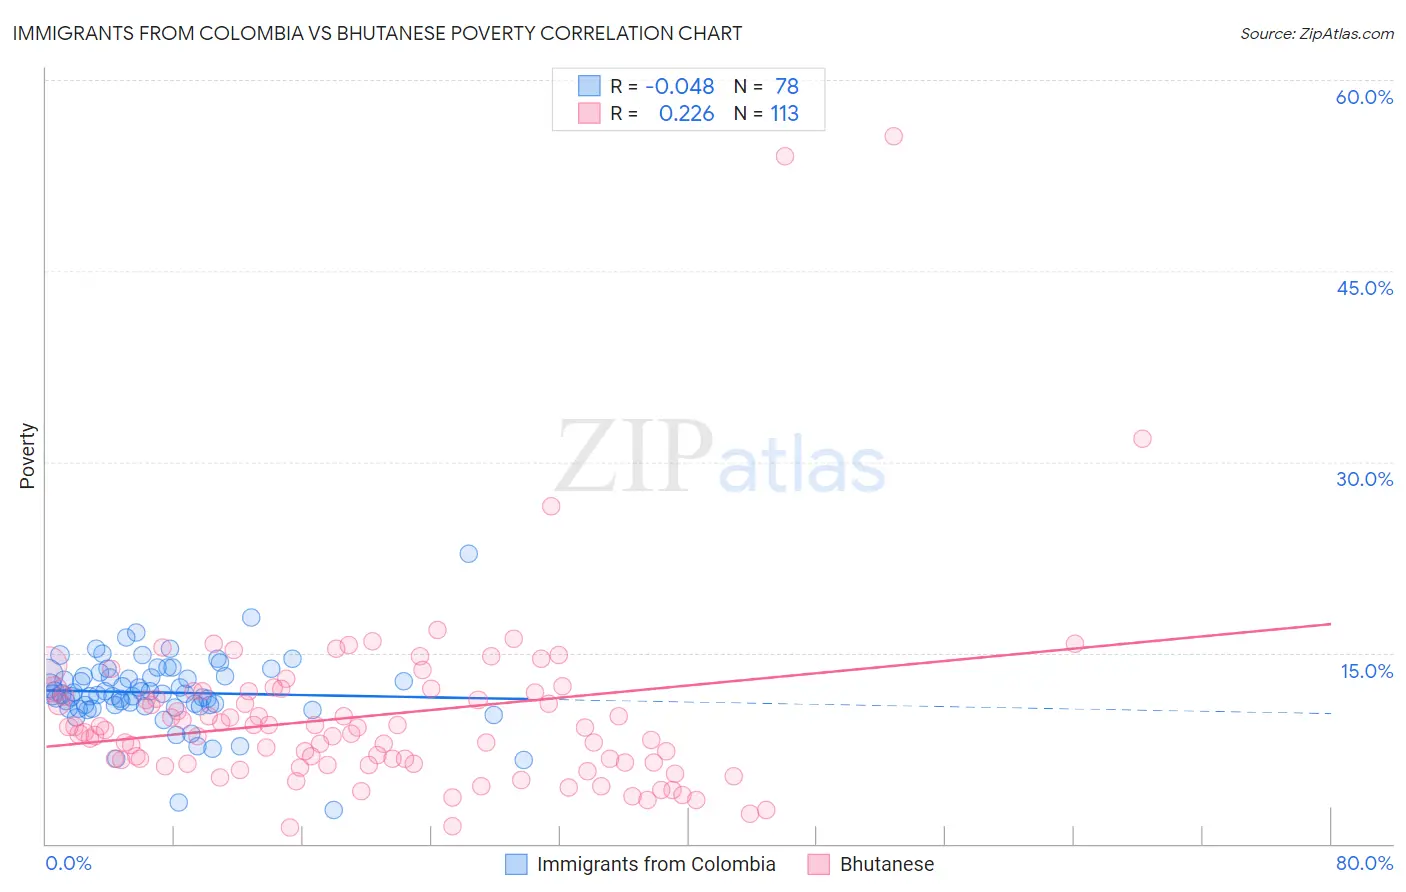
Immigrants from Colombia vs Bhutanese Poverty Correlation Chart
The statistical analysis conducted on geographies consisting of 378,485,502 people shows no correlation between the proportion of Immigrants from Colombia and poverty level in the United States with a correlation coefficient (R) of -0.048 and weighted average of 12.3%. Similarly, the statistical analysis conducted on geographies consisting of 455,158,170 people shows a weak positive correlation between the proportion of Bhutanese and poverty level in the United States with a correlation coefficient (R) of 0.226 and weighted average of 10.4%, a difference of 18.9%.
Poverty Correlation Summary
| Measurement | Immigrants from Colombia | Bhutanese |
| Minimum | 2.6% | 1.3% |
| Maximum | 22.8% | 55.6% |
| Range | 20.2% | 54.3% |
| Mean | 11.9% | 10.1% |
| Median | 11.8% | 9.0% |
| Interquartile 25% (IQ1) | 10.8% | 6.3% |
| Interquartile 75% (IQ3) | 13.2% | 12.0% |
| Interquartile Range (IQR) | 2.3% | 5.6% |
| Standard Deviation (Sample) | 2.8% | 7.5% |
| Standard Deviation (Population) | 2.8% | 7.5% |
Similar Demographics by Poverty
Demographics Similar to Immigrants from Colombia by Poverty
In terms of poverty, the demographic groups most similar to Immigrants from Colombia are Immigrants from Syria (12.3%, a difference of 0.020%), South American (12.3%, a difference of 0.090%), Lebanese (12.3%, a difference of 0.23%), Celtic (12.3%, a difference of 0.24%), and Immigrants from Portugal (12.3%, a difference of 0.28%).
| Demographics | Rating | Rank | Poverty |
| Whites/Caucasians | 55.4 /100 | #169 | Average 12.3% |
| Immigrants | Oceania | 54.6 /100 | #170 | Average 12.3% |
| Immigrants | Spain | 51.3 /100 | #171 | Average 12.3% |
| Immigrants | Portugal | 50.5 /100 | #172 | Average 12.3% |
| Celtics | 50.1 /100 | #173 | Average 12.3% |
| Lebanese | 50.0 /100 | #174 | Average 12.3% |
| South Americans | 48.7 /100 | #175 | Average 12.3% |
| Immigrants | Colombia | 47.7 /100 | #176 | Average 12.3% |
| Immigrants | Syria | 47.5 /100 | #177 | Average 12.3% |
| Uruguayans | 44.7 /100 | #178 | Average 12.4% |
| Immigrants | Morocco | 44.0 /100 | #179 | Average 12.4% |
| Mongolians | 43.6 /100 | #180 | Average 12.4% |
| Immigrants | Afghanistan | 42.1 /100 | #181 | Average 12.4% |
| Immigrants | Cameroon | 41.7 /100 | #182 | Average 12.4% |
| Immigrants | Iraq | 40.2 /100 | #183 | Average 12.4% |
Demographics Similar to Bhutanese by Poverty
In terms of poverty, the demographic groups most similar to Bhutanese are Immigrants from Hong Kong (10.4%, a difference of 0.22%), Immigrants from Lithuania (10.3%, a difference of 0.35%), Immigrants from Bolivia (10.4%, a difference of 0.53%), Bolivian (10.4%, a difference of 0.54%), and Lithuanian (10.5%, a difference of 0.84%).
| Demographics | Rating | Rank | Poverty |
| Immigrants | Ireland | 99.9 /100 | #5 | Exceptional 10.1% |
| Assyrians/Chaldeans/Syriacs | 99.9 /100 | #6 | Exceptional 10.1% |
| Filipinos | 99.9 /100 | #7 | Exceptional 10.1% |
| Maltese | 99.9 /100 | #8 | Exceptional 10.2% |
| Immigrants | South Central Asia | 99.9 /100 | #9 | Exceptional 10.2% |
| Bulgarians | 99.9 /100 | #10 | Exceptional 10.2% |
| Immigrants | Lithuania | 99.9 /100 | #11 | Exceptional 10.3% |
| Bhutanese | 99.8 /100 | #12 | Exceptional 10.4% |
| Immigrants | Hong Kong | 99.8 /100 | #13 | Exceptional 10.4% |
| Immigrants | Bolivia | 99.8 /100 | #14 | Exceptional 10.4% |
| Bolivians | 99.8 /100 | #15 | Exceptional 10.4% |
| Lithuanians | 99.8 /100 | #16 | Exceptional 10.5% |
| Norwegians | 99.8 /100 | #17 | Exceptional 10.5% |
| Latvians | 99.8 /100 | #18 | Exceptional 10.5% |
| Immigrants | Scotland | 99.7 /100 | #19 | Exceptional 10.6% |