Immigrants from Colombia vs Pennsylvania German Poverty
COMPARE
Immigrants from Colombia
Pennsylvania German
Poverty
Poverty Comparison
Immigrants from Colombia
Pennsylvania Germans
12.3%
POVERTY
47.7/ 100
METRIC RATING
176th/ 347
METRIC RANK
12.2%
POVERTY
60.8/ 100
METRIC RATING
159th/ 347
METRIC RANK
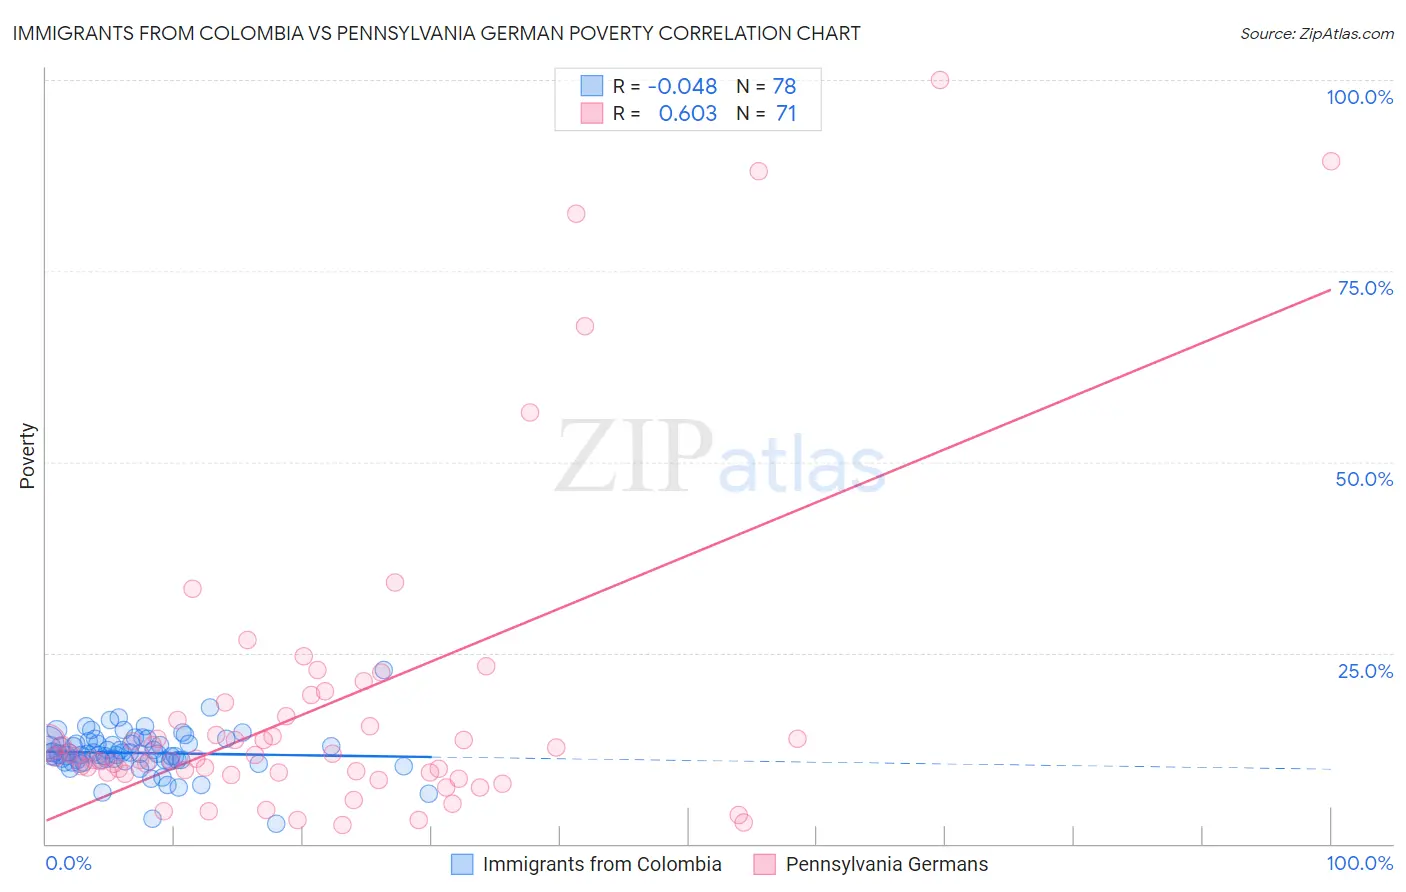
Immigrants from Colombia vs Pennsylvania German Poverty Correlation Chart
The statistical analysis conducted on geographies consisting of 378,485,502 people shows no correlation between the proportion of Immigrants from Colombia and poverty level in the United States with a correlation coefficient (R) of -0.048 and weighted average of 12.3%. Similarly, the statistical analysis conducted on geographies consisting of 234,033,089 people shows a significant positive correlation between the proportion of Pennsylvania Germans and poverty level in the United States with a correlation coefficient (R) of 0.603 and weighted average of 12.2%, a difference of 1.3%.
Poverty Correlation Summary
| Measurement | Immigrants from Colombia | Pennsylvania German |
| Minimum | 2.6% | 2.4% |
| Maximum | 22.8% | 100.0% |
| Range | 20.2% | 97.6% |
| Mean | 11.9% | 18.1% |
| Median | 11.8% | 11.4% |
| Interquartile 25% (IQ1) | 10.8% | 9.3% |
| Interquartile 75% (IQ3) | 13.2% | 16.7% |
| Interquartile Range (IQR) | 2.3% | 7.5% |
| Standard Deviation (Sample) | 2.8% | 20.6% |
| Standard Deviation (Population) | 2.8% | 20.5% |
Demographics Similar to Immigrants from Colombia and Pennsylvania Germans by Poverty
In terms of poverty, the demographic groups most similar to Immigrants from Colombia are Immigrants from Syria (12.3%, a difference of 0.020%), South American (12.3%, a difference of 0.090%), Lebanese (12.3%, a difference of 0.23%), Celtic (12.3%, a difference of 0.24%), and Immigrants from Portugal (12.3%, a difference of 0.28%). Similarly, the demographic groups most similar to Pennsylvania Germans are Immigrants from Nepal (12.2%, a difference of 0.050%), Taiwanese (12.2%, a difference of 0.10%), Costa Rican (12.2%, a difference of 0.14%), Immigrants from Fiji (12.2%, a difference of 0.18%), and Ethiopian (12.2%, a difference of 0.18%).
| Demographics | Rating | Rank | Poverty |
| Costa Ricans | 62.2 /100 | #157 | Good 12.2% |
| Taiwanese | 61.8 /100 | #158 | Good 12.2% |
| Pennsylvania Germans | 60.8 /100 | #159 | Good 12.2% |
| Immigrants | Nepal | 60.4 /100 | #160 | Good 12.2% |
| Immigrants | Fiji | 59.1 /100 | #161 | Average 12.2% |
| Ethiopians | 59.1 /100 | #162 | Average 12.2% |
| Immigrants | Ethiopia | 58.6 /100 | #163 | Average 12.2% |
| Colombians | 57.8 /100 | #164 | Average 12.2% |
| Immigrants | Albania | 57.7 /100 | #165 | Average 12.2% |
| Venezuelans | 56.9 /100 | #166 | Average 12.2% |
| Immigrants | Chile | 56.7 /100 | #167 | Average 12.2% |
| Immigrants | Venezuela | 56.5 /100 | #168 | Average 12.2% |
| Whites/Caucasians | 55.4 /100 | #169 | Average 12.3% |
| Immigrants | Oceania | 54.6 /100 | #170 | Average 12.3% |
| Immigrants | Spain | 51.3 /100 | #171 | Average 12.3% |
| Immigrants | Portugal | 50.5 /100 | #172 | Average 12.3% |
| Celtics | 50.1 /100 | #173 | Average 12.3% |
| Lebanese | 50.0 /100 | #174 | Average 12.3% |
| South Americans | 48.7 /100 | #175 | Average 12.3% |
| Immigrants | Colombia | 47.7 /100 | #176 | Average 12.3% |
| Immigrants | Syria | 47.5 /100 | #177 | Average 12.3% |