Immigrants from Colombia vs Spanish Poverty
COMPARE
Immigrants from Colombia
Spanish
Poverty
Poverty Comparison
Immigrants from Colombia
Spanish
12.3%
POVERTY
47.7/ 100
METRIC RATING
176th/ 347
METRIC RANK
12.8%
POVERTY
18.7/ 100
METRIC RATING
198th/ 347
METRIC RANK
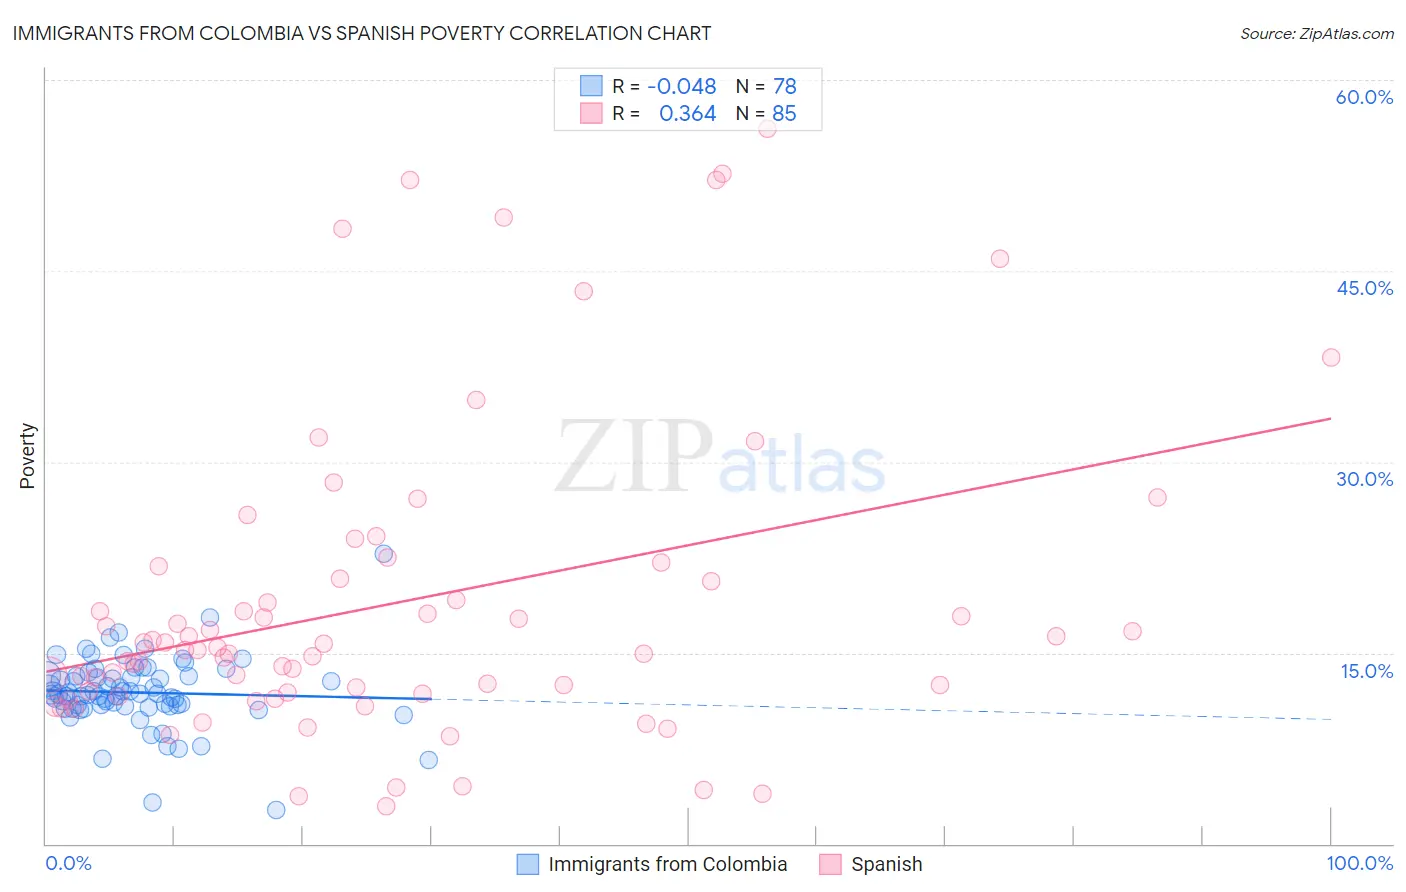
Immigrants from Colombia vs Spanish Poverty Correlation Chart
The statistical analysis conducted on geographies consisting of 378,485,502 people shows no correlation between the proportion of Immigrants from Colombia and poverty level in the United States with a correlation coefficient (R) of -0.048 and weighted average of 12.3%. Similarly, the statistical analysis conducted on geographies consisting of 421,940,954 people shows a mild positive correlation between the proportion of Spanish and poverty level in the United States with a correlation coefficient (R) of 0.364 and weighted average of 12.8%, a difference of 3.3%.
Poverty Correlation Summary
| Measurement | Immigrants from Colombia | Spanish |
| Minimum | 2.6% | 3.0% |
| Maximum | 22.8% | 56.1% |
| Range | 20.2% | 53.2% |
| Mean | 11.9% | 18.9% |
| Median | 11.8% | 15.2% |
| Interquartile 25% (IQ1) | 10.8% | 11.8% |
| Interquartile 75% (IQ3) | 13.2% | 21.3% |
| Interquartile Range (IQR) | 2.3% | 9.5% |
| Standard Deviation (Sample) | 2.8% | 12.1% |
| Standard Deviation (Population) | 2.8% | 12.1% |
Similar Demographics by Poverty
Demographics Similar to Immigrants from Colombia by Poverty
In terms of poverty, the demographic groups most similar to Immigrants from Colombia are Immigrants from Syria (12.3%, a difference of 0.020%), South American (12.3%, a difference of 0.090%), Lebanese (12.3%, a difference of 0.23%), Celtic (12.3%, a difference of 0.24%), and Immigrants from Portugal (12.3%, a difference of 0.28%).
| Demographics | Rating | Rank | Poverty |
| Whites/Caucasians | 55.4 /100 | #169 | Average 12.3% |
| Immigrants | Oceania | 54.6 /100 | #170 | Average 12.3% |
| Immigrants | Spain | 51.3 /100 | #171 | Average 12.3% |
| Immigrants | Portugal | 50.5 /100 | #172 | Average 12.3% |
| Celtics | 50.1 /100 | #173 | Average 12.3% |
| Lebanese | 50.0 /100 | #174 | Average 12.3% |
| South Americans | 48.7 /100 | #175 | Average 12.3% |
| Immigrants | Colombia | 47.7 /100 | #176 | Average 12.3% |
| Immigrants | Syria | 47.5 /100 | #177 | Average 12.3% |
| Uruguayans | 44.7 /100 | #178 | Average 12.4% |
| Immigrants | Morocco | 44.0 /100 | #179 | Average 12.4% |
| Mongolians | 43.6 /100 | #180 | Average 12.4% |
| Immigrants | Afghanistan | 42.1 /100 | #181 | Average 12.4% |
| Immigrants | Cameroon | 41.7 /100 | #182 | Average 12.4% |
| Immigrants | Iraq | 40.2 /100 | #183 | Average 12.4% |
Demographics Similar to Spanish by Poverty
In terms of poverty, the demographic groups most similar to Spanish are Immigrants from Lebanon (12.8%, a difference of 0.010%), Immigrants from Kenya (12.8%, a difference of 0.19%), Iraqi (12.7%, a difference of 0.31%), Immigrants from Kuwait (12.7%, a difference of 0.33%), and Spaniard (12.8%, a difference of 0.35%).
| Demographics | Rating | Rank | Poverty |
| Sierra Leoneans | 31.5 /100 | #191 | Fair 12.6% |
| South American Indians | 23.3 /100 | #192 | Fair 12.7% |
| Delaware | 21.4 /100 | #193 | Fair 12.7% |
| Arabs | 21.1 /100 | #194 | Fair 12.7% |
| Immigrants | Kuwait | 20.9 /100 | #195 | Fair 12.7% |
| Iraqis | 20.8 /100 | #196 | Fair 12.7% |
| Immigrants | Lebanon | 18.7 /100 | #197 | Poor 12.8% |
| Spanish | 18.7 /100 | #198 | Poor 12.8% |
| Immigrants | Kenya | 17.5 /100 | #199 | Poor 12.8% |
| Spaniards | 16.5 /100 | #200 | Poor 12.8% |
| Immigrants | Uganda | 16.5 /100 | #201 | Poor 12.8% |
| Immigrants | Uruguay | 15.6 /100 | #202 | Poor 12.8% |
| Hmong | 15.0 /100 | #203 | Poor 12.8% |
| Immigrants | Western Asia | 14.1 /100 | #204 | Poor 12.9% |
| Tsimshian | 9.2 /100 | #205 | Tragic 13.0% |