Immigrants from Colombia vs British Female Poverty

COMPARE

Immigrants from Colombia
Race
Ancestry
AfghanAfricanAlaska NativeAlaskan AthabascanAlbanianAleutAlsatianAmericanApacheArabArapahoArgentineanArmenianAssyrian/Chaldean/SyriacAustralianAustrianBahamianBangladeshiBarbadianBasqueBelgianBelizeanBermudanBhutaneseBlackfeetBolivianBrazilianBritish West IndianBulgarianBurmeseCajunCambodianCanadianCape VerdeanCarpatho RusynCelticCentral AmericanCentral American IndianCherokeeCheyenneChickasawChileanChineseChippewaChoctawColombianColvilleComancheCosta RicanCreeCreekCroatianCrowCubanCypriotCzechCzechoslovakianDanishDelawareDominicanDutchDutch West IndianEastern EuropeanEcuadorianEgyptianEnglishEstonianEthiopianEuropeanFijianFilipinoFinnishFrenchFrench American IndianFrench CanadianGermanGerman RussianGhanaianGreekGuamanian/ChamorroGuatemalanGuyaneseHaitianHmongHonduranHopiHoumaHungarianIcelanderIndian (Asian)IndonesianInupiatIranianIraqiIrishIroquoisIsraeliItalianJamaicanJapaneseJordanianKenyanKiowaKoreanLaotianLatvianLebaneseLiberianLithuanianLumbeeLuxembourgerMacedonianMalaysianMalteseMarshalleseMenomineeMexicanMexican American IndianMongolianMoroccanNative HawaiianNavajoNepaleseNew ZealanderNicaraguanNigerianNorthern EuropeanNorwegianOkinawanOsageOttawaPaiutePakistaniPalestinianPanamanianParaguayanPennsylvania GermanPeruvianPimaPolishPortuguesePotawatomiPuebloPuerto RicanPuget Sound SalishRomanianRussianSalvadoranSamoanScandinavianScotch-IrishScottishSeminoleSenegaleseSerbianShoshoneSierra LeoneanSiouxSlavicSlovakSloveneSomaliSouth AfricanSouth AmericanSouth American IndianSoviet UnionSpaniardSpanishSpanish AmericanSpanish American IndianSri LankanSubsaharan AfricanSudaneseSwedishSwissSyrianTaiwaneseThaiTlingit-HaidaTohono O'OdhamTonganTrinidadian and TobagonianTsimshianTurkishU.S. Virgin IslanderUgandanUkrainianUruguayanUteVenezuelanVietnameseWelshWest IndianYakamaYaquiYugoslavianYumanYup'ikZimbabwean
Immigration
NonimmigrantsImmigrantsAfghanistanAfricaAlbaniaArgentinaArmeniaAsiaAustraliaAustriaBahamasBangladeshBarbadosBelarusBelgiumBelizeBoliviaBosnia and HerzegovinaBrazilBulgariaBurma/MyanmarCabo VerdeCambodiaCameroonCanadaCaribbeanCentral AmericaChileChinaColombiaCongoCosta RicaCroatiaCubaCzechoslovakiaDenmarkDominicaDominican RepublicEastern AfricaEastern AsiaEastern EuropeEcuadorEgyptEl SalvadorEnglandEritreaEthiopiaEuropeFijiFranceGermanyGhanaGreeceGrenadaGuatemalaGuyanaHaitiHondurasHong KongHungaryIndiaIndonesiaIranIraqIrelandIsraelItalyJamaicaJapanJordanKazakhstanKenyaKoreaKuwaitLaosLatin AmericaLatviaLebanonLiberiaLithuaniaMalaysiaMexicoMicronesiaMiddle AfricaMoldovaMoroccoNepalNetherlandsNicaraguaNigeriaNorth AmericaNorth MacedoniaNorthern AfricaNorthern EuropeNorwayOceaniaPakistanPanamaPeruPhilippinesPolandPortugalRomaniaRussiaSaudi ArabiaScotlandSenegalSerbiaSierra LeoneSingaporeSomaliaSouth AfricaSouth AmericaSouth Central AsiaSouth Eastern AsiaSouthern EuropeSpainSri LankaSt. Vincent and the GrenadinesSudanSwedenSwitzerlandSyriaTaiwanThailandTrinidad and TobagoTurkeyUgandaUkraineUruguayUzbekistanVenezuelaVietnamWest IndiesWestern AfricaWestern AsiaWestern EuropeYemenZaireZimbabweAzores
British
Race
Ancestry
AfghanAfricanAlaska NativeAlaskan AthabascanAlbanianAleutAlsatianAmericanApacheArabArapahoArgentineanArmenianAssyrian/Chaldean/SyriacAustralianAustrianBahamianBangladeshiBarbadianBasqueBelgianBelizeanBermudanBhutaneseBlackfeetBolivianBrazilianBritishBritish West IndianBulgarianBurmeseCajunCambodianCanadianCape VerdeanCarpatho RusynCelticCentral AmericanCentral American IndianCherokeeCheyenneChickasawChileanChineseChippewaChoctawColombianColvilleComancheCosta RicanCreeCreekCroatianCrowCubanCypriotCzechCzechoslovakianDanishDelawareDominicanDutchDutch West IndianEastern EuropeanEcuadorianEgyptianEnglishEstonianEthiopianEuropeanFijianFilipinoFinnishFrenchFrench American IndianFrench CanadianGermanGerman RussianGhanaianGreekGuamanian/ChamorroGuatemalanGuyaneseHaitianHmongHonduranHopiHoumaHungarianIcelanderIndian (Asian)IndonesianInupiatIranianIraqiIrishIroquoisIsraeliItalianJamaicanJapaneseJordanianKenyanKiowaKoreanLaotianLatvianLebaneseLiberianLithuanianLumbeeLuxembourgerMacedonianMalaysianMalteseMarshalleseMenomineeMexicanMexican American IndianMongolianMoroccanNative HawaiianNavajoNepaleseNew ZealanderNicaraguanNigerianNorthern EuropeanNorwegianOkinawanOsageOttawaPaiutePakistaniPalestinianPanamanianParaguayanPennsylvania GermanPeruvianPimaPolishPortuguesePotawatomiPuebloPuerto RicanPuget Sound SalishRomanianRussianSalvadoranSamoanScandinavianScotch-IrishScottishSeminoleSenegaleseSerbianShoshoneSierra LeoneanSiouxSlavicSlovakSloveneSomaliSouth AfricanSouth AmericanSouth American IndianSoviet UnionSpaniardSpanishSpanish AmericanSpanish American IndianSri LankanSubsaharan AfricanSudaneseSwedishSwissSyrianTaiwaneseThaiTlingit-HaidaTohono O'OdhamTonganTrinidadian and TobagonianTsimshianTurkishU.S. Virgin IslanderUgandanUkrainianUruguayanUteVenezuelanVietnameseWelshWest IndianYakamaYaquiYugoslavianYumanYup'ikZimbabwean
Immigration
NonimmigrantsImmigrantsAfghanistanAfricaAlbaniaArgentinaArmeniaAsiaAustraliaAustriaBahamasBangladeshBarbadosBelarusBelgiumBelizeBoliviaBosnia and HerzegovinaBrazilBulgariaBurma/MyanmarCabo VerdeCambodiaCameroonCanadaCaribbeanCentral AmericaChileChinaCongoCosta RicaCroatiaCubaCzechoslovakiaDenmarkDominicaDominican RepublicEastern AfricaEastern AsiaEastern EuropeEcuadorEgyptEl SalvadorEnglandEritreaEthiopiaEuropeFijiFranceGermanyGhanaGreeceGrenadaGuatemalaGuyanaHaitiHondurasHong KongHungaryIndiaIndonesiaIranIraqIrelandIsraelItalyJamaicaJapanJordanKazakhstanKenyaKoreaKuwaitLaosLatin AmericaLatviaLebanonLiberiaLithuaniaMalaysiaMexicoMicronesiaMiddle AfricaMoldovaMoroccoNepalNetherlandsNicaraguaNigeriaNorth AmericaNorth MacedoniaNorthern AfricaNorthern EuropeNorwayOceaniaPakistanPanamaPeruPhilippinesPolandPortugalRomaniaRussiaSaudi ArabiaScotlandSenegalSerbiaSierra LeoneSingaporeSomaliaSouth AfricaSouth AmericaSouth Central AsiaSouth Eastern AsiaSouthern EuropeSpainSri LankaSt. Vincent and the GrenadinesSudanSwedenSwitzerlandSyriaTaiwanThailandTrinidad and TobagoTurkeyUgandaUkraineUruguayUzbekistanVenezuelaVietnamWest IndiesWestern AfricaWestern AsiaWestern EuropeYemenZaireZimbabweAzores
Female Poverty
Income
Poverty
Unemployment
Labor Participation
Family Structure
Vehicle Availability
Education Level
Disability

Female Poverty Comparison

Immigrants from Colombia

British

Average
Exceptional
13.5%
FEMALE POVERTY
44.5/ 100
METRIC RATING
182nd/ 347
METRIC RANK
12.5%
FEMALE POVERTY
95.2/ 100
METRIC RATING
96th/ 347
METRIC RANK

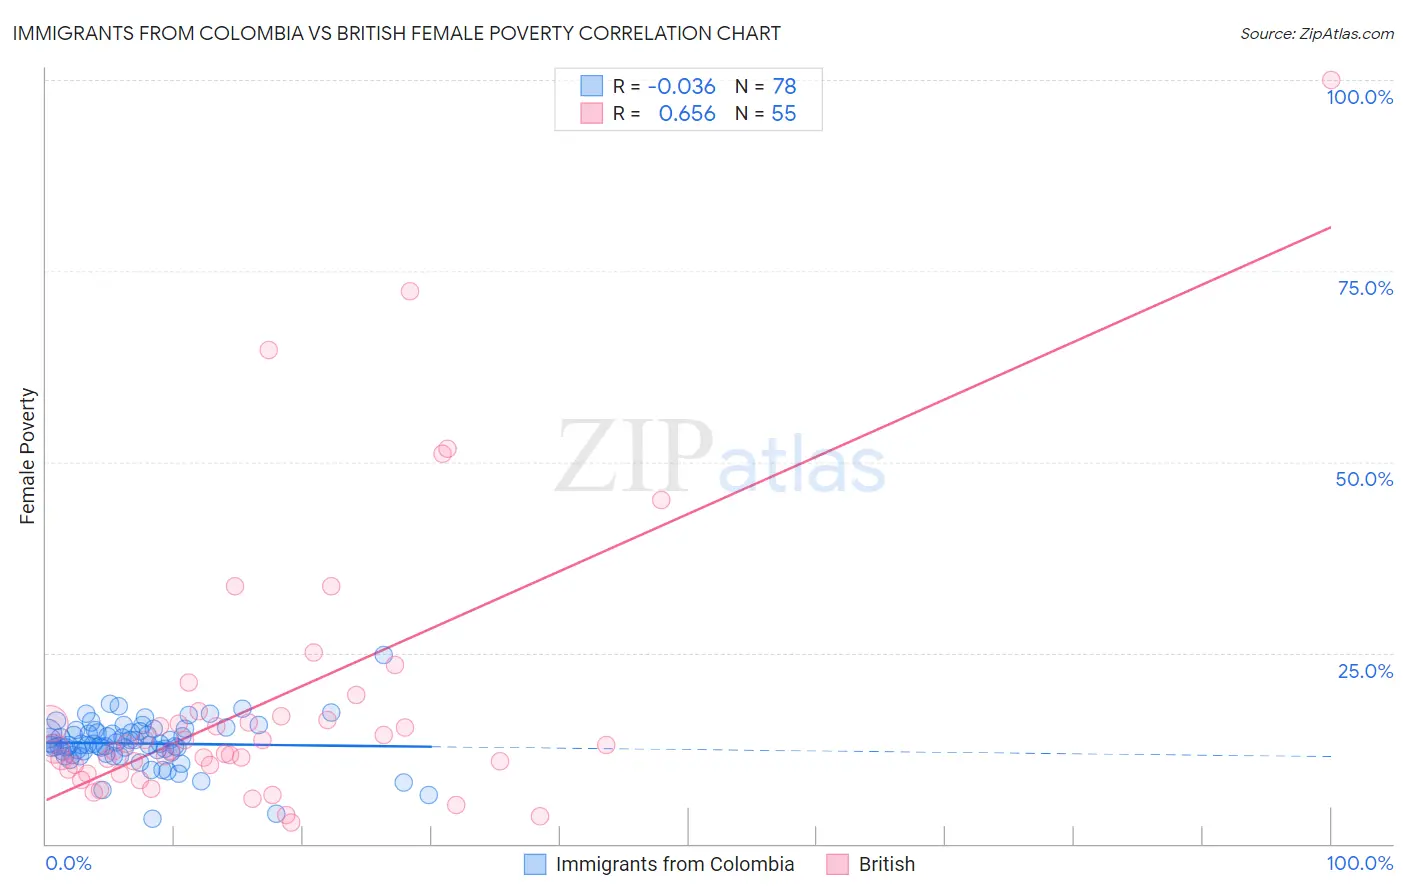
Immigrants from Colombia vs British Female Poverty Correlation Chart

The statistical analysis conducted on geographies consisting of 378,418,098 people shows no correlation between the proportion of Immigrants from Colombia and poverty level among females in the United States with a correlation coefficient (R) of -0.036 and weighted average of 13.5%. Similarly, the statistical analysis conducted on geographies consisting of 530,738,327 people shows a significant positive correlation between the proportion of British and poverty level among females in the United States with a correlation coefficient (R) of 0.656 and weighted average of 12.5%, a difference of 8.3%.
Immigrants from Colombia vs British Female Poverty

Female Poverty Correlation Summary

MeasurementImmigrants from ColombiaBritish
Minimum3.2%2.7%
Maximum24.7%100.0%
Range21.5%97.3%
Mean13.1%18.5%
Median13.1%12.4%
Interquartile 25% (IQ1)11.9%9.8%
Interquartile 75% (IQ3)14.7%16.6%
Interquartile Range (IQR)2.8%6.8%
Standard Deviation (Sample)3.1%18.3%
Standard Deviation (Population)3.1%18.1%

Similar Demographics by Female Poverty

Demographics Similar to Immigrants from Colombia by Female Poverty

In terms of female poverty, the demographic groups most similar to Immigrants from Colombia are Venezuelan (13.5%, a difference of 0.0%), South American (13.5%, a difference of 0.030%), Kenyan (13.5%, a difference of 0.070%), Immigrants from Sierra Leone (13.5%, a difference of 0.13%), and Immigrants from Cameroon (13.5%, a difference of 0.24%).
DemographicsRating | RankFemale Poverty
Celtics
49.9
/100
|
#175
Average
13.4%
Immigrants | Spain
49.9
/100
|
#176
Average
13.4%
Immigrants | Morocco
49.4
/100
|
#177
Average
13.4%
Israelis
49.1
/100
|
#178
Average
13.5%
Immigrants | Syria
48.8
/100
|
#179
Average
13.5%
South Americans
44.8
/100
|
#180
Average
13.5%
Venezuelans
44.5
/100
|
#181
Average
13.5%
Immigrants | Colombia
44.5
/100
|
#182
Average
13.5%
Kenyans
43.8
/100
|
#183
Average
13.5%
Immigrants | Sierra Leone
43.2
/100
|
#184
Average
13.5%
Immigrants | Cameroon
42.0
/100
|
#185
Average
13.5%
Immigrants | Portugal
41.5
/100
|
#186
Average
13.6%
Immigrants | Venezuela
41.0
/100
|
#187
Average
13.6%
Hawaiians
39.9
/100
|
#188
Fair
13.6%
Uruguayans
39.8
/100
|
#189
Fair
13.6%

Demographics Similar to British by Female Poverty

In terms of female poverty, the demographic groups most similar to British are Australian (12.5%, a difference of 0.030%), Native Hawaiian (12.5%, a difference of 0.050%), Immigrants from South Africa (12.5%, a difference of 0.070%), Romanian (12.5%, a difference of 0.070%), and Immigrants from Indonesia (12.5%, a difference of 0.11%).
DemographicsRating | RankFemale Poverty
English
96.1
/100
|
#89
Exceptional
12.4%
Immigrants | Denmark
95.8
/100
|
#90
Exceptional
12.4%
Belgians
95.8
/100
|
#91
Exceptional
12.4%
Czechoslovakians
95.7
/100
|
#92
Exceptional
12.4%
Immigrants | Egypt
95.5
/100
|
#93
Exceptional
12.5%
Immigrants | Indonesia
95.4
/100
|
#94
Exceptional
12.5%
Immigrants | South Africa
95.4
/100
|
#95
Exceptional
12.5%
British
95.2
/100
|
#96
Exceptional
12.5%
Australians
95.2
/100
|
#97
Exceptional
12.5%
Native Hawaiians
95.1
/100
|
#98
Exceptional
12.5%
Romanians
95.1
/100
|
#99
Exceptional
12.5%
Immigrants | Latvia
94.8
/100
|
#100
Exceptional
12.5%
Tlingit-Haida
94.8
/100
|
#101
Exceptional
12.5%
Immigrants | China
94.5
/100
|
#102
Exceptional
12.5%
Slavs
94.5
/100
|
#103
Exceptional
12.5%