Immigrants from Cabo Verde vs British Female Poverty
COMPARE
Immigrants from Cabo Verde
British
Female Poverty
Female Poverty Comparison
Immigrants from Cabo Verde
British
16.4%
FEMALE POVERTY
0.0/ 100
METRIC RATING
294th/ 347
METRIC RANK
12.5%
FEMALE POVERTY
95.2/ 100
METRIC RATING
96th/ 347
METRIC RANK
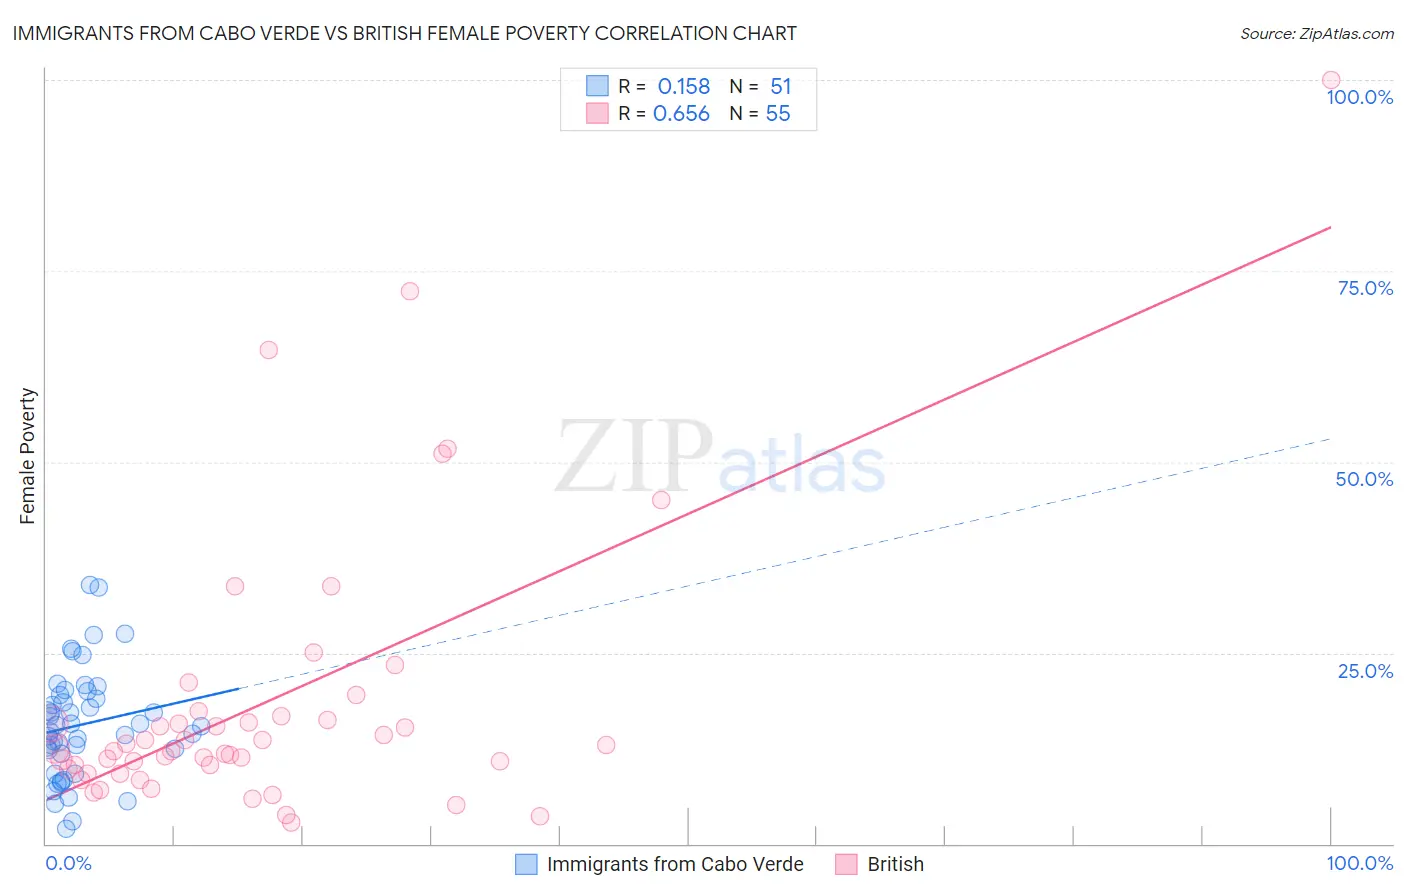
Immigrants from Cabo Verde vs British Female Poverty Correlation Chart
The statistical analysis conducted on geographies consisting of 38,143,060 people shows a poor positive correlation between the proportion of Immigrants from Cabo Verde and poverty level among females in the United States with a correlation coefficient (R) of 0.158 and weighted average of 16.4%. Similarly, the statistical analysis conducted on geographies consisting of 530,738,327 people shows a significant positive correlation between the proportion of British and poverty level among females in the United States with a correlation coefficient (R) of 0.656 and weighted average of 12.5%, a difference of 31.8%.
Female Poverty Correlation Summary
| Measurement | Immigrants from Cabo Verde | British |
| Minimum | 2.0% | 2.7% |
| Maximum | 33.8% | 100.0% |
| Range | 31.8% | 97.3% |
| Mean | 15.6% | 18.5% |
| Median | 15.4% | 12.4% |
| Interquartile 25% (IQ1) | 11.8% | 9.8% |
| Interquartile 75% (IQ3) | 19.6% | 16.6% |
| Interquartile Range (IQR) | 7.7% | 6.8% |
| Standard Deviation (Sample) | 7.1% | 18.3% |
| Standard Deviation (Population) | 7.0% | 18.1% |
Similar Demographics by Female Poverty
Demographics Similar to Immigrants from Cabo Verde by Female Poverty
In terms of female poverty, the demographic groups most similar to Immigrants from Cabo Verde are Immigrants from Latin America (16.4%, a difference of 0.030%), Senegalese (16.5%, a difference of 0.080%), Immigrants from Zaire (16.4%, a difference of 0.090%), Yaqui (16.4%, a difference of 0.10%), and Immigrants from Senegal (16.5%, a difference of 0.10%).
| Demographics | Rating | Rank | Female Poverty |
| Immigrants | Belize | 0.0 /100 | #287 | Tragic 16.3% |
| Indonesians | 0.0 /100 | #288 | Tragic 16.4% |
| Blackfeet | 0.0 /100 | #289 | Tragic 16.4% |
| Immigrants | Bangladesh | 0.0 /100 | #290 | Tragic 16.4% |
| Yaqui | 0.0 /100 | #291 | Tragic 16.4% |
| Immigrants | Zaire | 0.0 /100 | #292 | Tragic 16.4% |
| Immigrants | Latin America | 0.0 /100 | #293 | Tragic 16.4% |
| Immigrants | Cabo Verde | 0.0 /100 | #294 | Tragic 16.4% |
| Senegalese | 0.0 /100 | #295 | Tragic 16.5% |
| Immigrants | Senegal | 0.0 /100 | #296 | Tragic 16.5% |
| Mexicans | 0.0 /100 | #297 | Tragic 16.5% |
| Somalis | 0.0 /100 | #298 | Tragic 16.6% |
| Hispanics or Latinos | 0.0 /100 | #299 | Tragic 16.6% |
| Bahamians | 0.0 /100 | #300 | Tragic 16.6% |
| Guatemalans | 0.0 /100 | #301 | Tragic 16.7% |
Demographics Similar to British by Female Poverty
In terms of female poverty, the demographic groups most similar to British are Australian (12.5%, a difference of 0.030%), Native Hawaiian (12.5%, a difference of 0.050%), Immigrants from South Africa (12.5%, a difference of 0.070%), Romanian (12.5%, a difference of 0.070%), and Immigrants from Indonesia (12.5%, a difference of 0.11%).
| Demographics | Rating | Rank | Female Poverty |
| English | 96.1 /100 | #89 | Exceptional 12.4% |
| Immigrants | Denmark | 95.8 /100 | #90 | Exceptional 12.4% |
| Belgians | 95.8 /100 | #91 | Exceptional 12.4% |
| Czechoslovakians | 95.7 /100 | #92 | Exceptional 12.4% |
| Immigrants | Egypt | 95.5 /100 | #93 | Exceptional 12.5% |
| Immigrants | Indonesia | 95.4 /100 | #94 | Exceptional 12.5% |
| Immigrants | South Africa | 95.4 /100 | #95 | Exceptional 12.5% |
| British | 95.2 /100 | #96 | Exceptional 12.5% |
| Australians | 95.2 /100 | #97 | Exceptional 12.5% |
| Native Hawaiians | 95.1 /100 | #98 | Exceptional 12.5% |
| Romanians | 95.1 /100 | #99 | Exceptional 12.5% |
| Immigrants | Latvia | 94.8 /100 | #100 | Exceptional 12.5% |
| Tlingit-Haida | 94.8 /100 | #101 | Exceptional 12.5% |
| Immigrants | China | 94.5 /100 | #102 | Exceptional 12.5% |
| Slavs | 94.5 /100 | #103 | Exceptional 12.5% |