Immigrants from Colombia vs Armenian Female Poverty
COMPARE
Immigrants from Colombia
Armenian
Female Poverty
Female Poverty Comparison
Immigrants from Colombia
Armenians
13.5%
FEMALE POVERTY
44.5/ 100
METRIC RATING
182nd/ 347
METRIC RANK
13.2%
FEMALE POVERTY
70.4/ 100
METRIC RATING
154th/ 347
METRIC RANK
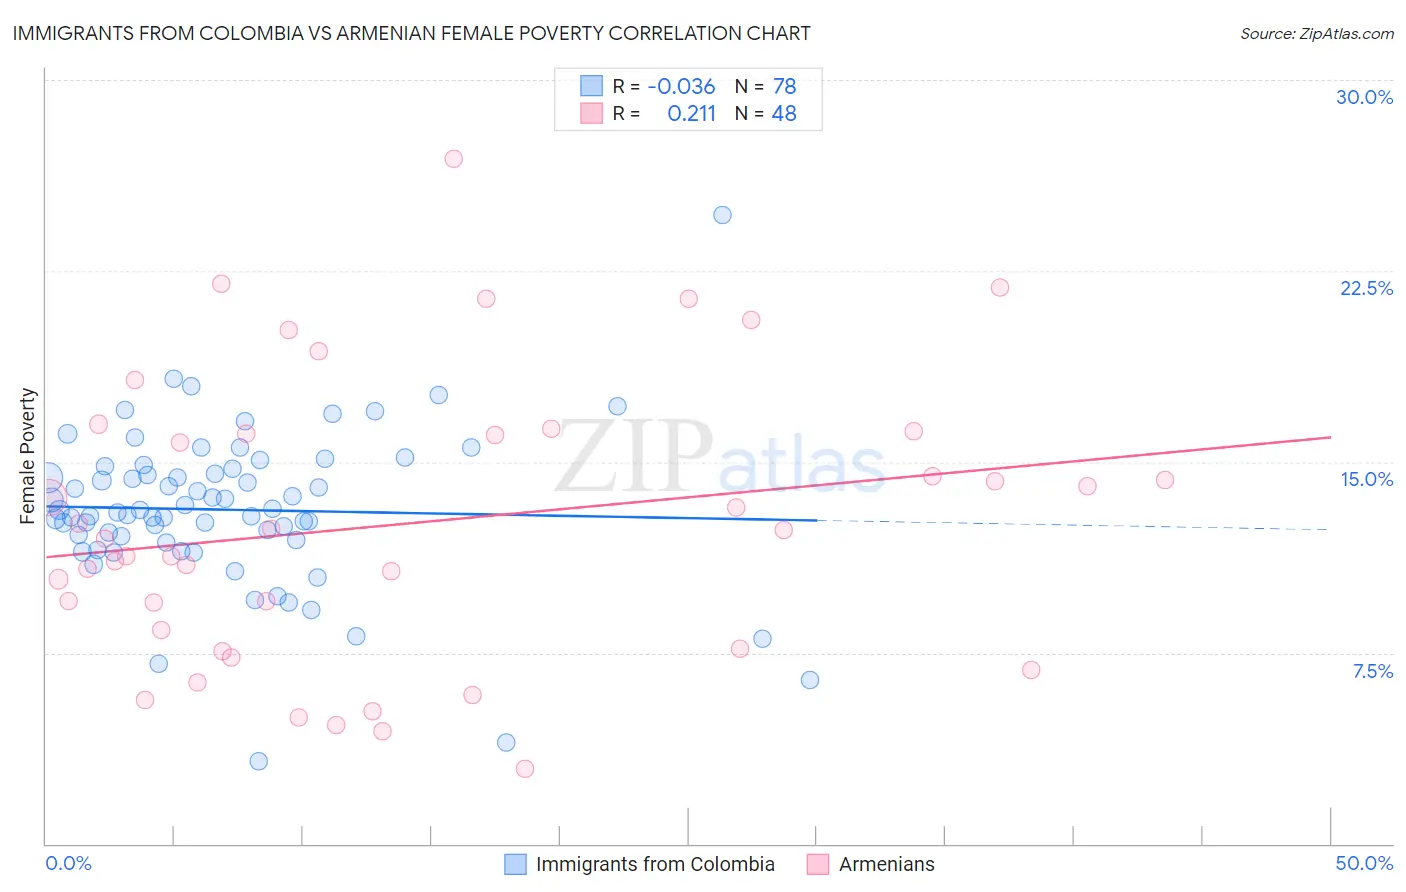
Immigrants from Colombia vs Armenian Female Poverty Correlation Chart
The statistical analysis conducted on geographies consisting of 378,418,098 people shows no correlation between the proportion of Immigrants from Colombia and poverty level among females in the United States with a correlation coefficient (R) of -0.036 and weighted average of 13.5%. Similarly, the statistical analysis conducted on geographies consisting of 310,749,032 people shows a weak positive correlation between the proportion of Armenians and poverty level among females in the United States with a correlation coefficient (R) of 0.211 and weighted average of 13.2%, a difference of 2.7%.
Female Poverty Correlation Summary
| Measurement | Immigrants from Colombia | Armenian |
| Minimum | 3.2% | 2.9% |
| Maximum | 24.7% | 26.9% |
| Range | 21.5% | 24.0% |
| Mean | 13.1% | 12.6% |
| Median | 13.1% | 12.1% |
| Interquartile 25% (IQ1) | 11.9% | 8.0% |
| Interquartile 75% (IQ3) | 14.7% | 16.2% |
| Interquartile Range (IQR) | 2.8% | 8.1% |
| Standard Deviation (Sample) | 3.1% | 5.6% |
| Standard Deviation (Population) | 3.1% | 5.5% |
Similar Demographics by Female Poverty
Demographics Similar to Immigrants from Colombia by Female Poverty
In terms of female poverty, the demographic groups most similar to Immigrants from Colombia are Venezuelan (13.5%, a difference of 0.0%), South American (13.5%, a difference of 0.030%), Kenyan (13.5%, a difference of 0.070%), Immigrants from Sierra Leone (13.5%, a difference of 0.13%), and Immigrants from Cameroon (13.5%, a difference of 0.24%).
| Demographics | Rating | Rank | Female Poverty |
| Celtics | 49.9 /100 | #175 | Average 13.4% |
| Immigrants | Spain | 49.9 /100 | #176 | Average 13.4% |
| Immigrants | Morocco | 49.4 /100 | #177 | Average 13.4% |
| Israelis | 49.1 /100 | #178 | Average 13.5% |
| Immigrants | Syria | 48.8 /100 | #179 | Average 13.5% |
| South Americans | 44.8 /100 | #180 | Average 13.5% |
| Venezuelans | 44.5 /100 | #181 | Average 13.5% |
| Immigrants | Colombia | 44.5 /100 | #182 | Average 13.5% |
| Kenyans | 43.8 /100 | #183 | Average 13.5% |
| Immigrants | Sierra Leone | 43.2 /100 | #184 | Average 13.5% |
| Immigrants | Cameroon | 42.0 /100 | #185 | Average 13.5% |
| Immigrants | Portugal | 41.5 /100 | #186 | Average 13.6% |
| Immigrants | Venezuela | 41.0 /100 | #187 | Average 13.6% |
| Hawaiians | 39.9 /100 | #188 | Fair 13.6% |
| Uruguayans | 39.8 /100 | #189 | Fair 13.6% |
Demographics Similar to Armenians by Female Poverty
In terms of female poverty, the demographic groups most similar to Armenians are Hungarian (13.2%, a difference of 0.040%), Immigrants from Fiji (13.2%, a difference of 0.070%), Immigrants from Bosnia and Herzegovina (13.2%, a difference of 0.090%), Immigrants from Northern Africa (13.2%, a difference of 0.19%), and Pennsylvania German (13.2%, a difference of 0.36%).
| Demographics | Rating | Rank | Female Poverty |
| Immigrants | Kazakhstan | 78.6 /100 | #147 | Good 13.0% |
| Yugoslavians | 76.9 /100 | #148 | Good 13.1% |
| Taiwanese | 75.7 /100 | #149 | Good 13.1% |
| Tsimshian | 75.5 /100 | #150 | Good 13.1% |
| Immigrants | Germany | 74.9 /100 | #151 | Good 13.1% |
| Samoans | 73.6 /100 | #152 | Good 13.1% |
| Immigrants | Fiji | 71.0 /100 | #153 | Good 13.2% |
| Armenians | 70.4 /100 | #154 | Good 13.2% |
| Hungarians | 70.1 /100 | #155 | Good 13.2% |
| Immigrants | Bosnia and Herzegovina | 69.7 /100 | #156 | Good 13.2% |
| Immigrants | Northern Africa | 68.8 /100 | #157 | Good 13.2% |
| Pennsylvania Germans | 67.3 /100 | #158 | Good 13.2% |
| Costa Ricans | 63.6 /100 | #159 | Good 13.3% |
| Immigrants | Nepal | 62.7 /100 | #160 | Good 13.3% |
| Immigrants | Ethiopia | 62.5 /100 | #161 | Good 13.3% |