Immigrants from China vs Bermudan Single Male Poverty
COMPARE
Immigrants from China
Bermudan
Single Male Poverty
Single Male Poverty Comparison
Immigrants from China
Bermudans
11.4%
SINGLE MALE POVERTY
100.0/ 100
METRIC RATING
27th/ 347
METRIC RANK
13.1%
SINGLE MALE POVERTY
13.0/ 100
METRIC RATING
217th/ 347
METRIC RANK
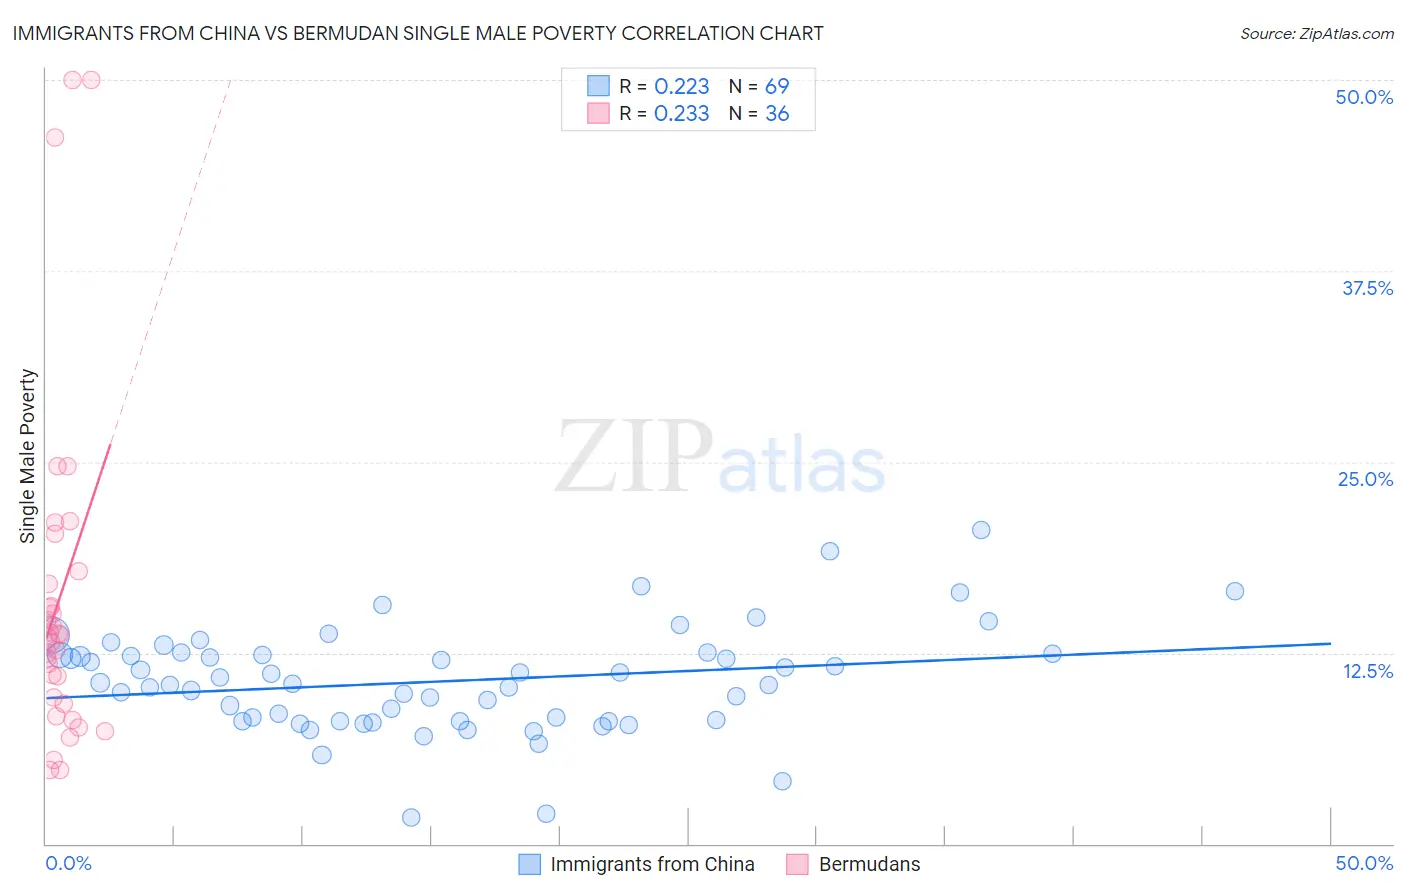
Immigrants from China vs Bermudan Single Male Poverty Correlation Chart
The statistical analysis conducted on geographies consisting of 395,740,575 people shows a weak positive correlation between the proportion of Immigrants from China and poverty level among single males in the United States with a correlation coefficient (R) of 0.223 and weighted average of 11.4%. Similarly, the statistical analysis conducted on geographies consisting of 54,324,345 people shows a weak positive correlation between the proportion of Bermudans and poverty level among single males in the United States with a correlation coefficient (R) of 0.233 and weighted average of 13.1%, a difference of 15.3%.
Single Male Poverty Correlation Summary
| Measurement | Immigrants from China | Bermudan |
| Minimum | 1.7% | 4.8% |
| Maximum | 20.6% | 50.0% |
| Range | 18.8% | 45.2% |
| Mean | 10.6% | 16.1% |
| Median | 10.5% | 13.6% |
| Interquartile 25% (IQ1) | 8.0% | 9.4% |
| Interquartile 75% (IQ3) | 12.4% | 17.5% |
| Interquartile Range (IQR) | 4.4% | 8.1% |
| Standard Deviation (Sample) | 3.4% | 11.2% |
| Standard Deviation (Population) | 3.4% | 11.0% |
Similar Demographics by Single Male Poverty
Demographics Similar to Immigrants from China by Single Male Poverty
In terms of single male poverty, the demographic groups most similar to Immigrants from China are Immigrants from Asia (11.4%, a difference of 0.070%), Immigrants from Egypt (11.4%, a difference of 0.17%), Iranian (11.4%, a difference of 0.23%), Immigrants from Iran (11.4%, a difference of 0.32%), and Immigrants from Eastern Asia (11.4%, a difference of 0.40%).
| Demographics | Rating | Rank | Single Male Poverty |
| Ethiopians | 100.0 /100 | #20 | Exceptional 11.2% |
| Asians | 100.0 /100 | #21 | Exceptional 11.2% |
| Immigrants | Pakistan | 100.0 /100 | #22 | Exceptional 11.2% |
| Bolivians | 100.0 /100 | #23 | Exceptional 11.2% |
| Indians (Asian) | 100.0 /100 | #24 | Exceptional 11.3% |
| Maltese | 100.0 /100 | #25 | Exceptional 11.3% |
| Immigrants | Japan | 100.0 /100 | #26 | Exceptional 11.3% |
| Immigrants | China | 100.0 /100 | #27 | Exceptional 11.4% |
| Immigrants | Asia | 100.0 /100 | #28 | Exceptional 11.4% |
| Immigrants | Egypt | 100.0 /100 | #29 | Exceptional 11.4% |
| Iranians | 100.0 /100 | #30 | Exceptional 11.4% |
| Immigrants | Iran | 100.0 /100 | #31 | Exceptional 11.4% |
| Immigrants | Eastern Asia | 100.0 /100 | #32 | Exceptional 11.4% |
| Immigrants | Vietnam | 100.0 /100 | #33 | Exceptional 11.4% |
| Immigrants | Ethiopia | 100.0 /100 | #34 | Exceptional 11.4% |
Demographics Similar to Bermudans by Single Male Poverty
In terms of single male poverty, the demographic groups most similar to Bermudans are Scandinavian (13.1%, a difference of 0.020%), Immigrants from Burma/Myanmar (13.1%, a difference of 0.050%), Austrian (13.1%, a difference of 0.10%), Japanese (13.1%, a difference of 0.19%), and Zimbabwean (13.1%, a difference of 0.20%).
| Demographics | Rating | Rank | Single Male Poverty |
| Immigrants | Haiti | 16.8 /100 | #210 | Poor 13.1% |
| Swedes | 16.8 /100 | #211 | Poor 13.1% |
| Senegalese | 16.4 /100 | #212 | Poor 13.1% |
| Italians | 15.9 /100 | #213 | Poor 13.1% |
| Zimbabweans | 14.9 /100 | #214 | Poor 13.1% |
| Japanese | 14.8 /100 | #215 | Poor 13.1% |
| Austrians | 13.9 /100 | #216 | Poor 13.1% |
| Bermudans | 13.0 /100 | #217 | Poor 13.1% |
| Scandinavians | 12.9 /100 | #218 | Poor 13.1% |
| Immigrants | Burma/Myanmar | 12.6 /100 | #219 | Poor 13.1% |
| Central Americans | 10.9 /100 | #220 | Poor 13.2% |
| New Zealanders | 10.7 /100 | #221 | Poor 13.2% |
| Immigrants | Western Europe | 10.0 /100 | #222 | Poor 13.2% |
| Immigrants | Azores | 9.3 /100 | #223 | Tragic 13.2% |
| Somalis | 9.1 /100 | #224 | Tragic 13.2% |