Immigrants from Kenya vs Bermudan Single Male Poverty
COMPARE
Immigrants from Kenya
Bermudan
Single Male Poverty
Single Male Poverty Comparison
Immigrants from Kenya
Bermudans
12.5%
SINGLE MALE POVERTY
87.6/ 100
METRIC RATING
123rd/ 347
METRIC RANK
13.1%
SINGLE MALE POVERTY
13.0/ 100
METRIC RATING
217th/ 347
METRIC RANK
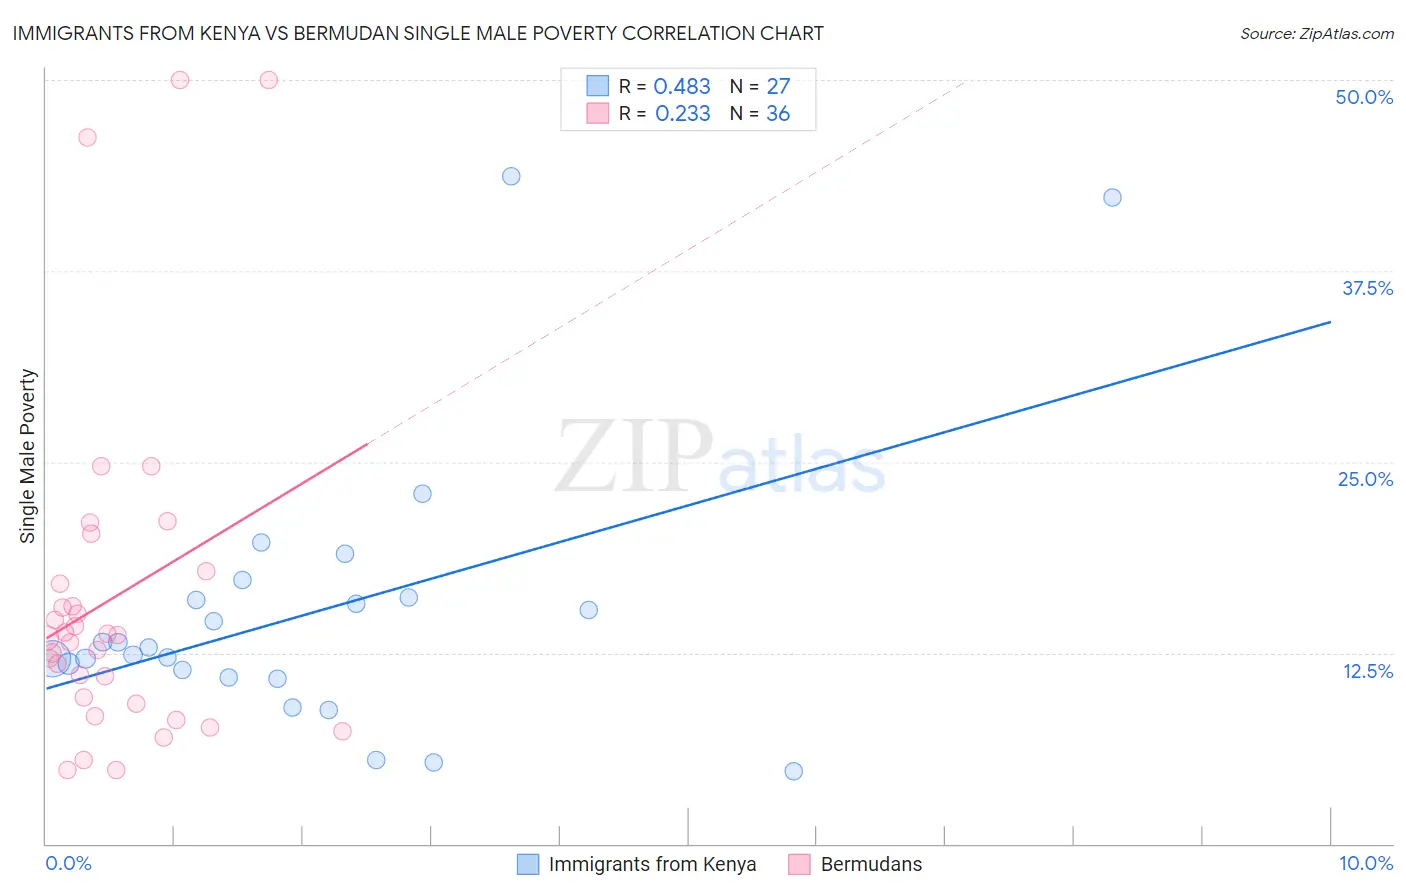
Immigrants from Kenya vs Bermudan Single Male Poverty Correlation Chart
The statistical analysis conducted on geographies consisting of 201,857,660 people shows a moderate positive correlation between the proportion of Immigrants from Kenya and poverty level among single males in the United States with a correlation coefficient (R) of 0.483 and weighted average of 12.5%. Similarly, the statistical analysis conducted on geographies consisting of 54,324,345 people shows a weak positive correlation between the proportion of Bermudans and poverty level among single males in the United States with a correlation coefficient (R) of 0.233 and weighted average of 13.1%, a difference of 5.2%.
Single Male Poverty Correlation Summary
| Measurement | Immigrants from Kenya | Bermudan |
| Minimum | 4.8% | 4.8% |
| Maximum | 43.7% | 50.0% |
| Range | 38.9% | 45.2% |
| Mean | 15.1% | 16.1% |
| Median | 12.9% | 13.6% |
| Interquartile 25% (IQ1) | 10.9% | 9.4% |
| Interquartile 75% (IQ3) | 16.1% | 17.5% |
| Interquartile Range (IQR) | 5.2% | 8.1% |
| Standard Deviation (Sample) | 9.1% | 11.2% |
| Standard Deviation (Population) | 8.9% | 11.0% |
Similar Demographics by Single Male Poverty
Demographics Similar to Immigrants from Kenya by Single Male Poverty
In terms of single male poverty, the demographic groups most similar to Immigrants from Kenya are Russian (12.5%, a difference of 0.030%), Serbian (12.5%, a difference of 0.040%), Immigrants from Jordan (12.5%, a difference of 0.060%), Icelander (12.5%, a difference of 0.090%), and Romanian (12.5%, a difference of 0.14%).
| Demographics | Rating | Rank | Single Male Poverty |
| Immigrants | Syria | 91.2 /100 | #116 | Exceptional 12.4% |
| Immigrants | Oceania | 91.1 /100 | #117 | Exceptional 12.4% |
| Albanians | 90.6 /100 | #118 | Exceptional 12.4% |
| Immigrants | Albania | 90.3 /100 | #119 | Exceptional 12.4% |
| Venezuelans | 89.4 /100 | #120 | Excellent 12.4% |
| Icelanders | 88.2 /100 | #121 | Excellent 12.5% |
| Serbians | 87.9 /100 | #122 | Excellent 12.5% |
| Immigrants | Kenya | 87.6 /100 | #123 | Excellent 12.5% |
| Russians | 87.3 /100 | #124 | Excellent 12.5% |
| Immigrants | Jordan | 87.1 /100 | #125 | Excellent 12.5% |
| Romanians | 86.4 /100 | #126 | Excellent 12.5% |
| Immigrants | Netherlands | 86.2 /100 | #127 | Excellent 12.5% |
| Ecuadorians | 85.9 /100 | #128 | Excellent 12.5% |
| Immigrants | Sierra Leone | 85.5 /100 | #129 | Excellent 12.5% |
| Immigrants | Nicaragua | 84.8 /100 | #130 | Excellent 12.5% |
Demographics Similar to Bermudans by Single Male Poverty
In terms of single male poverty, the demographic groups most similar to Bermudans are Scandinavian (13.1%, a difference of 0.020%), Immigrants from Burma/Myanmar (13.1%, a difference of 0.050%), Austrian (13.1%, a difference of 0.10%), Japanese (13.1%, a difference of 0.19%), and Zimbabwean (13.1%, a difference of 0.20%).
| Demographics | Rating | Rank | Single Male Poverty |
| Immigrants | Haiti | 16.8 /100 | #210 | Poor 13.1% |
| Swedes | 16.8 /100 | #211 | Poor 13.1% |
| Senegalese | 16.4 /100 | #212 | Poor 13.1% |
| Italians | 15.9 /100 | #213 | Poor 13.1% |
| Zimbabweans | 14.9 /100 | #214 | Poor 13.1% |
| Japanese | 14.8 /100 | #215 | Poor 13.1% |
| Austrians | 13.9 /100 | #216 | Poor 13.1% |
| Bermudans | 13.0 /100 | #217 | Poor 13.1% |
| Scandinavians | 12.9 /100 | #218 | Poor 13.1% |
| Immigrants | Burma/Myanmar | 12.6 /100 | #219 | Poor 13.1% |
| Central Americans | 10.9 /100 | #220 | Poor 13.2% |
| New Zealanders | 10.7 /100 | #221 | Poor 13.2% |
| Immigrants | Western Europe | 10.0 /100 | #222 | Poor 13.2% |
| Immigrants | Azores | 9.3 /100 | #223 | Tragic 13.2% |
| Somalis | 9.1 /100 | #224 | Tragic 13.2% |