Spanish vs Bermudan Single Male Poverty
COMPARE
Spanish
Bermudan
Single Male Poverty
Single Male Poverty Comparison
Spanish
Bermudans
13.6%
SINGLE MALE POVERTY
1.0/ 100
METRIC RATING
249th/ 347
METRIC RANK
13.1%
SINGLE MALE POVERTY
13.0/ 100
METRIC RATING
217th/ 347
METRIC RANK
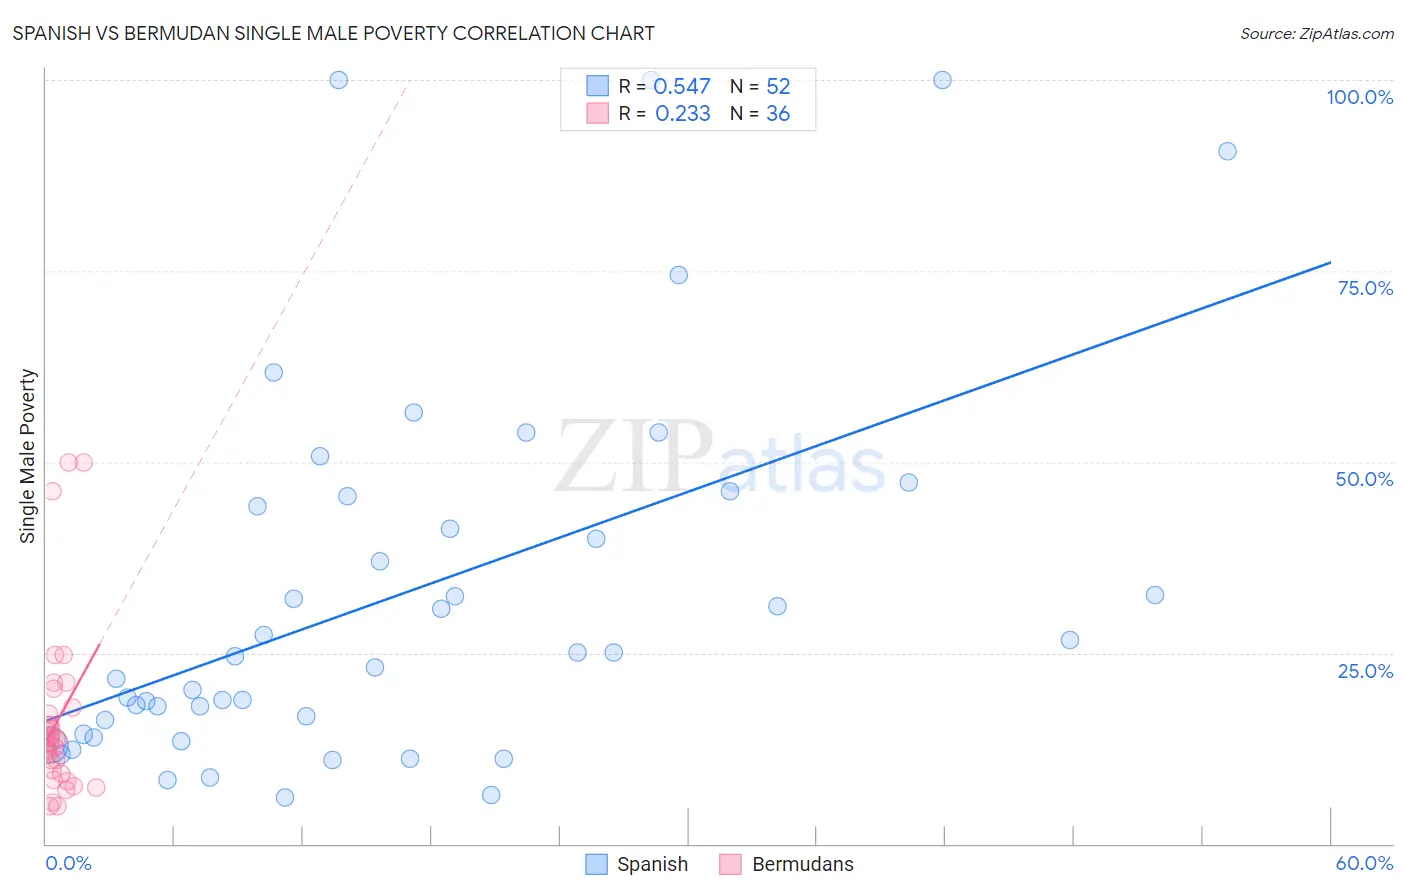
Spanish vs Bermudan Single Male Poverty Correlation Chart
The statistical analysis conducted on geographies consisting of 373,377,488 people shows a substantial positive correlation between the proportion of Spanish and poverty level among single males in the United States with a correlation coefficient (R) of 0.547 and weighted average of 13.6%. Similarly, the statistical analysis conducted on geographies consisting of 54,324,345 people shows a weak positive correlation between the proportion of Bermudans and poverty level among single males in the United States with a correlation coefficient (R) of 0.233 and weighted average of 13.1%, a difference of 3.5%.
Single Male Poverty Correlation Summary
| Measurement | Spanish | Bermudan |
| Minimum | 6.1% | 4.8% |
| Maximum | 100.0% | 50.0% |
| Range | 93.9% | 45.2% |
| Mean | 32.7% | 16.1% |
| Median | 24.8% | 13.6% |
| Interquartile 25% (IQ1) | 15.3% | 9.4% |
| Interquartile 75% (IQ3) | 44.8% | 17.5% |
| Interquartile Range (IQR) | 29.6% | 8.1% |
| Standard Deviation (Sample) | 24.7% | 11.2% |
| Standard Deviation (Population) | 24.4% | 11.0% |
Similar Demographics by Single Male Poverty
Demographics Similar to Spanish by Single Male Poverty
In terms of single male poverty, the demographic groups most similar to Spanish are Immigrants from Somalia (13.6%, a difference of 0.020%), Immigrants from Zaire (13.6%, a difference of 0.13%), Finnish (13.6%, a difference of 0.17%), Czech (13.5%, a difference of 0.24%), and Belgian (13.5%, a difference of 0.27%).
| Demographics | Rating | Rank | Single Male Poverty |
| Carpatho Rusyns | 2.1 /100 | #242 | Tragic 13.4% |
| Barbadians | 2.1 /100 | #243 | Tragic 13.4% |
| Immigrants | Senegal | 1.7 /100 | #244 | Tragic 13.5% |
| Immigrants | Latin America | 1.3 /100 | #245 | Tragic 13.5% |
| Immigrants | Micronesia | 1.2 /100 | #246 | Tragic 13.5% |
| Belgians | 1.2 /100 | #247 | Tragic 13.5% |
| Czechs | 1.2 /100 | #248 | Tragic 13.5% |
| Spanish | 1.0 /100 | #249 | Tragic 13.6% |
| Immigrants | Somalia | 1.0 /100 | #250 | Tragic 13.6% |
| Immigrants | Zaire | 0.9 /100 | #251 | Tragic 13.6% |
| Finns | 0.9 /100 | #252 | Tragic 13.6% |
| German Russians | 0.8 /100 | #253 | Tragic 13.6% |
| Sub-Saharan Africans | 0.5 /100 | #254 | Tragic 13.7% |
| Spaniards | 0.4 /100 | #255 | Tragic 13.7% |
| Immigrants | Belize | 0.4 /100 | #256 | Tragic 13.7% |
Demographics Similar to Bermudans by Single Male Poverty
In terms of single male poverty, the demographic groups most similar to Bermudans are Scandinavian (13.1%, a difference of 0.020%), Immigrants from Burma/Myanmar (13.1%, a difference of 0.050%), Austrian (13.1%, a difference of 0.10%), Japanese (13.1%, a difference of 0.19%), and Zimbabwean (13.1%, a difference of 0.20%).
| Demographics | Rating | Rank | Single Male Poverty |
| Immigrants | Haiti | 16.8 /100 | #210 | Poor 13.1% |
| Swedes | 16.8 /100 | #211 | Poor 13.1% |
| Senegalese | 16.4 /100 | #212 | Poor 13.1% |
| Italians | 15.9 /100 | #213 | Poor 13.1% |
| Zimbabweans | 14.9 /100 | #214 | Poor 13.1% |
| Japanese | 14.8 /100 | #215 | Poor 13.1% |
| Austrians | 13.9 /100 | #216 | Poor 13.1% |
| Bermudans | 13.0 /100 | #217 | Poor 13.1% |
| Scandinavians | 12.9 /100 | #218 | Poor 13.1% |
| Immigrants | Burma/Myanmar | 12.6 /100 | #219 | Poor 13.1% |
| Central Americans | 10.9 /100 | #220 | Poor 13.2% |
| New Zealanders | 10.7 /100 | #221 | Poor 13.2% |
| Immigrants | Western Europe | 10.0 /100 | #222 | Poor 13.2% |
| Immigrants | Azores | 9.3 /100 | #223 | Tragic 13.2% |
| Somalis | 9.1 /100 | #224 | Tragic 13.2% |