Immigrants from Dominican Republic vs Bermudan Single Male Poverty
COMPARE
Immigrants from Dominican Republic
Bermudan
Single Male Poverty
Single Male Poverty Comparison
Immigrants from Dominican Republic
Bermudans
14.8%
SINGLE MALE POVERTY
0.0/ 100
METRIC RATING
297th/ 347
METRIC RANK
13.1%
SINGLE MALE POVERTY
13.0/ 100
METRIC RATING
217th/ 347
METRIC RANK
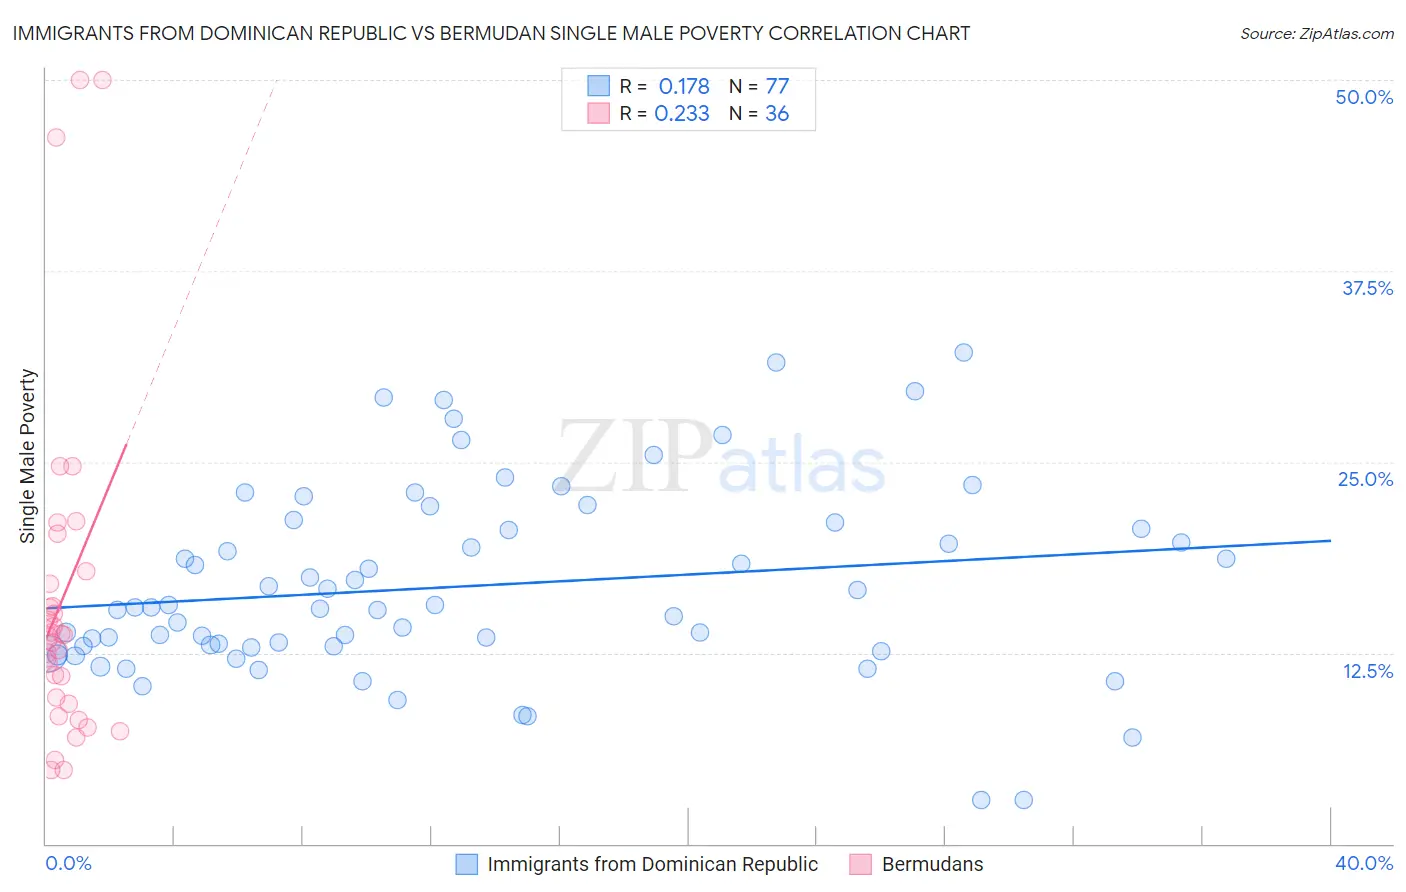
Immigrants from Dominican Republic vs Bermudan Single Male Poverty Correlation Chart
The statistical analysis conducted on geographies consisting of 249,403,835 people shows a poor positive correlation between the proportion of Immigrants from Dominican Republic and poverty level among single males in the United States with a correlation coefficient (R) of 0.178 and weighted average of 14.8%. Similarly, the statistical analysis conducted on geographies consisting of 54,324,345 people shows a weak positive correlation between the proportion of Bermudans and poverty level among single males in the United States with a correlation coefficient (R) of 0.233 and weighted average of 13.1%, a difference of 12.7%.
Single Male Poverty Correlation Summary
| Measurement | Immigrants from Dominican Republic | Bermudan |
| Minimum | 2.9% | 4.8% |
| Maximum | 32.2% | 50.0% |
| Range | 29.3% | 45.2% |
| Mean | 16.8% | 16.1% |
| Median | 15.4% | 13.6% |
| Interquartile 25% (IQ1) | 12.9% | 9.4% |
| Interquartile 75% (IQ3) | 20.8% | 17.5% |
| Interquartile Range (IQR) | 7.9% | 8.1% |
| Standard Deviation (Sample) | 6.2% | 11.2% |
| Standard Deviation (Population) | 6.2% | 11.0% |
Similar Demographics by Single Male Poverty
Demographics Similar to Immigrants from Dominican Republic by Single Male Poverty
In terms of single male poverty, the demographic groups most similar to Immigrants from Dominican Republic are African (14.7%, a difference of 0.35%), Scotch-Irish (14.7%, a difference of 0.67%), Ottawa (14.6%, a difference of 1.1%), French American Indian (15.0%, a difference of 1.3%), and French Canadian (14.6%, a difference of 1.3%).
| Demographics | Rating | Rank | Single Male Poverty |
| U.S. Virgin Islanders | 0.0 /100 | #290 | Tragic 14.5% |
| Bahamians | 0.0 /100 | #291 | Tragic 14.6% |
| Immigrants | Nonimmigrants | 0.0 /100 | #292 | Tragic 14.6% |
| French Canadians | 0.0 /100 | #293 | Tragic 14.6% |
| Ottawa | 0.0 /100 | #294 | Tragic 14.6% |
| Scotch-Irish | 0.0 /100 | #295 | Tragic 14.7% |
| Africans | 0.0 /100 | #296 | Tragic 14.7% |
| Immigrants | Dominican Republic | 0.0 /100 | #297 | Tragic 14.8% |
| French American Indians | 0.0 /100 | #298 | Tragic 15.0% |
| Delaware | 0.0 /100 | #299 | Tragic 15.0% |
| Cree | 0.0 /100 | #300 | Tragic 15.1% |
| Dominicans | 0.0 /100 | #301 | Tragic 15.2% |
| Alsatians | 0.0 /100 | #302 | Tragic 15.2% |
| Aleuts | 0.0 /100 | #303 | Tragic 15.4% |
| Alaska Natives | 0.0 /100 | #304 | Tragic 15.4% |
Demographics Similar to Bermudans by Single Male Poverty
In terms of single male poverty, the demographic groups most similar to Bermudans are Scandinavian (13.1%, a difference of 0.020%), Immigrants from Burma/Myanmar (13.1%, a difference of 0.050%), Austrian (13.1%, a difference of 0.10%), Japanese (13.1%, a difference of 0.19%), and Zimbabwean (13.1%, a difference of 0.20%).
| Demographics | Rating | Rank | Single Male Poverty |
| Immigrants | Haiti | 16.8 /100 | #210 | Poor 13.1% |
| Swedes | 16.8 /100 | #211 | Poor 13.1% |
| Senegalese | 16.4 /100 | #212 | Poor 13.1% |
| Italians | 15.9 /100 | #213 | Poor 13.1% |
| Zimbabweans | 14.9 /100 | #214 | Poor 13.1% |
| Japanese | 14.8 /100 | #215 | Poor 13.1% |
| Austrians | 13.9 /100 | #216 | Poor 13.1% |
| Bermudans | 13.0 /100 | #217 | Poor 13.1% |
| Scandinavians | 12.9 /100 | #218 | Poor 13.1% |
| Immigrants | Burma/Myanmar | 12.6 /100 | #219 | Poor 13.1% |
| Central Americans | 10.9 /100 | #220 | Poor 13.2% |
| New Zealanders | 10.7 /100 | #221 | Poor 13.2% |
| Immigrants | Western Europe | 10.0 /100 | #222 | Poor 13.2% |
| Immigrants | Azores | 9.3 /100 | #223 | Tragic 13.2% |
| Somalis | 9.1 /100 | #224 | Tragic 13.2% |