Immigrants from Laos vs Bermudan Single Male Poverty
COMPARE
Immigrants from Laos
Bermudan
Single Male Poverty
Single Male Poverty Comparison
Immigrants from Laos
Bermudans
13.0%
SINGLE MALE POVERTY
23.1/ 100
METRIC RATING
197th/ 347
METRIC RANK
13.1%
SINGLE MALE POVERTY
13.0/ 100
METRIC RATING
217th/ 347
METRIC RANK
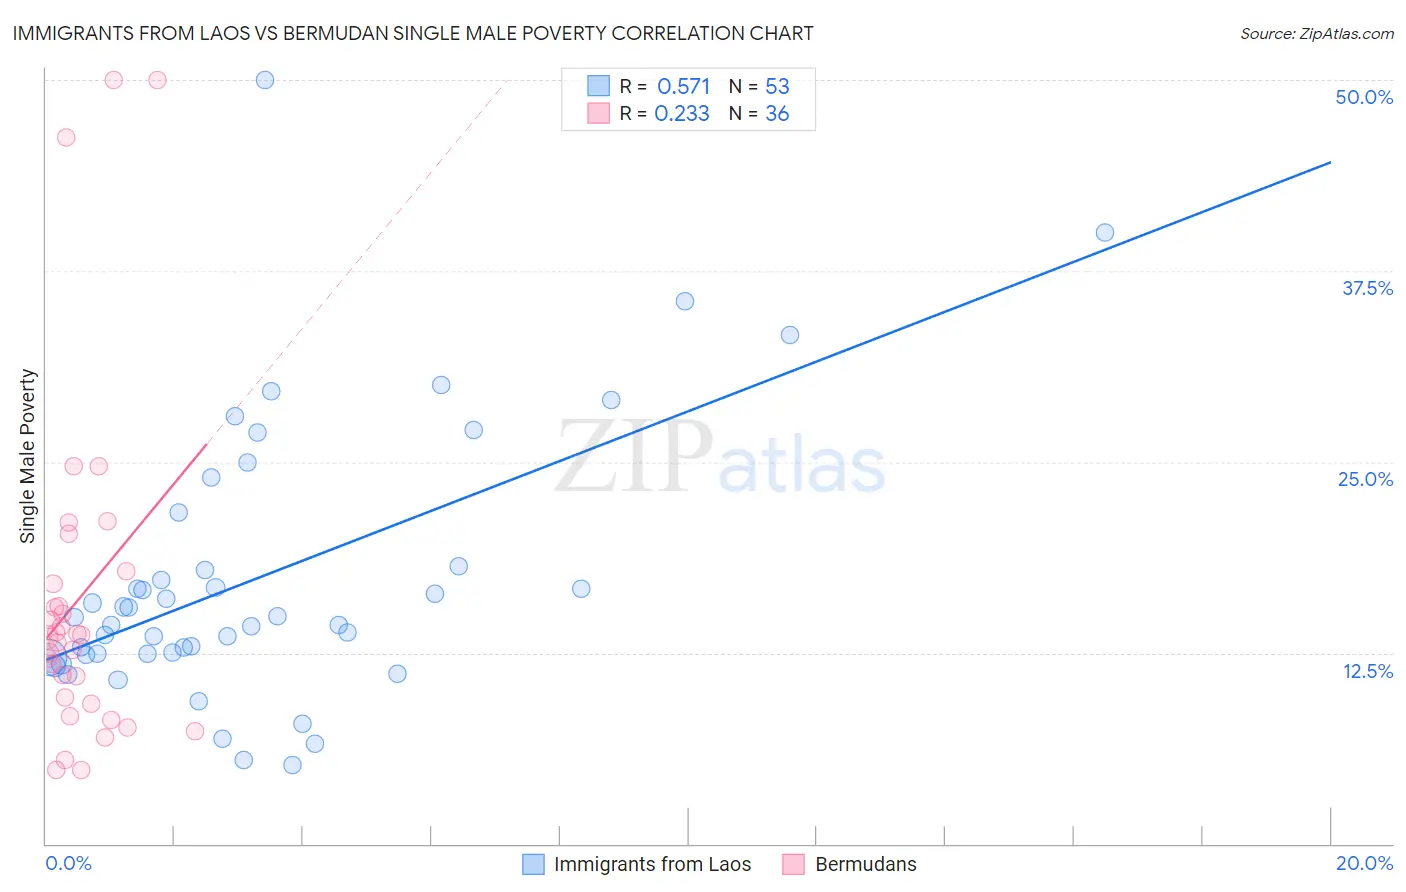
Immigrants from Laos vs Bermudan Single Male Poverty Correlation Chart
The statistical analysis conducted on geographies consisting of 188,644,362 people shows a substantial positive correlation between the proportion of Immigrants from Laos and poverty level among single males in the United States with a correlation coefficient (R) of 0.571 and weighted average of 13.0%. Similarly, the statistical analysis conducted on geographies consisting of 54,324,345 people shows a weak positive correlation between the proportion of Bermudans and poverty level among single males in the United States with a correlation coefficient (R) of 0.233 and weighted average of 13.1%, a difference of 0.90%.
Single Male Poverty Correlation Summary
| Measurement | Immigrants from Laos | Bermudan |
| Minimum | 5.2% | 4.8% |
| Maximum | 50.0% | 50.0% |
| Range | 44.8% | 45.2% |
| Mean | 17.5% | 16.1% |
| Median | 14.8% | 13.6% |
| Interquartile 25% (IQ1) | 12.4% | 9.4% |
| Interquartile 75% (IQ3) | 19.9% | 17.5% |
| Interquartile Range (IQR) | 7.5% | 8.1% |
| Standard Deviation (Sample) | 9.0% | 11.2% |
| Standard Deviation (Population) | 8.9% | 11.0% |
Demographics Similar to Immigrants from Laos and Bermudans by Single Male Poverty
In terms of single male poverty, the demographic groups most similar to Immigrants from Laos are Lithuanian (13.0%, a difference of 0.070%), Immigrants from Norway (13.0%, a difference of 0.10%), Slovene (13.0%, a difference of 0.11%), Trinidadian and Tobagonian (13.0%, a difference of 0.12%), and Basque (13.0%, a difference of 0.18%). Similarly, the demographic groups most similar to Bermudans are Austrian (13.1%, a difference of 0.10%), Japanese (13.1%, a difference of 0.19%), Zimbabwean (13.1%, a difference of 0.20%), Italian (13.1%, a difference of 0.30%), and Senegalese (13.1%, a difference of 0.35%).
| Demographics | Rating | Rank | Single Male Poverty |
| Immigrants | Laos | 23.1 /100 | #197 | Fair 13.0% |
| Lithuanians | 22.1 /100 | #198 | Fair 13.0% |
| Immigrants | Norway | 21.8 /100 | #199 | Fair 13.0% |
| Slovenes | 21.6 /100 | #200 | Fair 13.0% |
| Trinidadians and Tobagonians | 21.4 /100 | #201 | Fair 13.0% |
| Basques | 20.7 /100 | #202 | Fair 13.0% |
| Immigrants | Bangladesh | 20.4 /100 | #203 | Fair 13.0% |
| Estonians | 20.3 /100 | #204 | Fair 13.0% |
| Poles | 19.3 /100 | #205 | Poor 13.0% |
| Northern Europeans | 18.9 /100 | #206 | Poor 13.0% |
| Sudanese | 17.7 /100 | #207 | Poor 13.1% |
| Immigrants | Western Africa | 17.6 /100 | #208 | Poor 13.1% |
| Mexican American Indians | 17.5 /100 | #209 | Poor 13.1% |
| Immigrants | Haiti | 16.8 /100 | #210 | Poor 13.1% |
| Swedes | 16.8 /100 | #211 | Poor 13.1% |
| Senegalese | 16.4 /100 | #212 | Poor 13.1% |
| Italians | 15.9 /100 | #213 | Poor 13.1% |
| Zimbabweans | 14.9 /100 | #214 | Poor 13.1% |
| Japanese | 14.8 /100 | #215 | Poor 13.1% |
| Austrians | 13.9 /100 | #216 | Poor 13.1% |
| Bermudans | 13.0 /100 | #217 | Poor 13.1% |