Immigrants from Central America vs Chilean Male Poverty
COMPARE
Immigrants from Central America
Chilean
Male Poverty
Male Poverty Comparison
Immigrants from Central America
Chileans
13.9%
MALE POVERTY
0.0/ 100
METRIC RATING
295th/ 347
METRIC RANK
10.7%
MALE POVERTY
83.9/ 100
METRIC RATING
130th/ 347
METRIC RANK
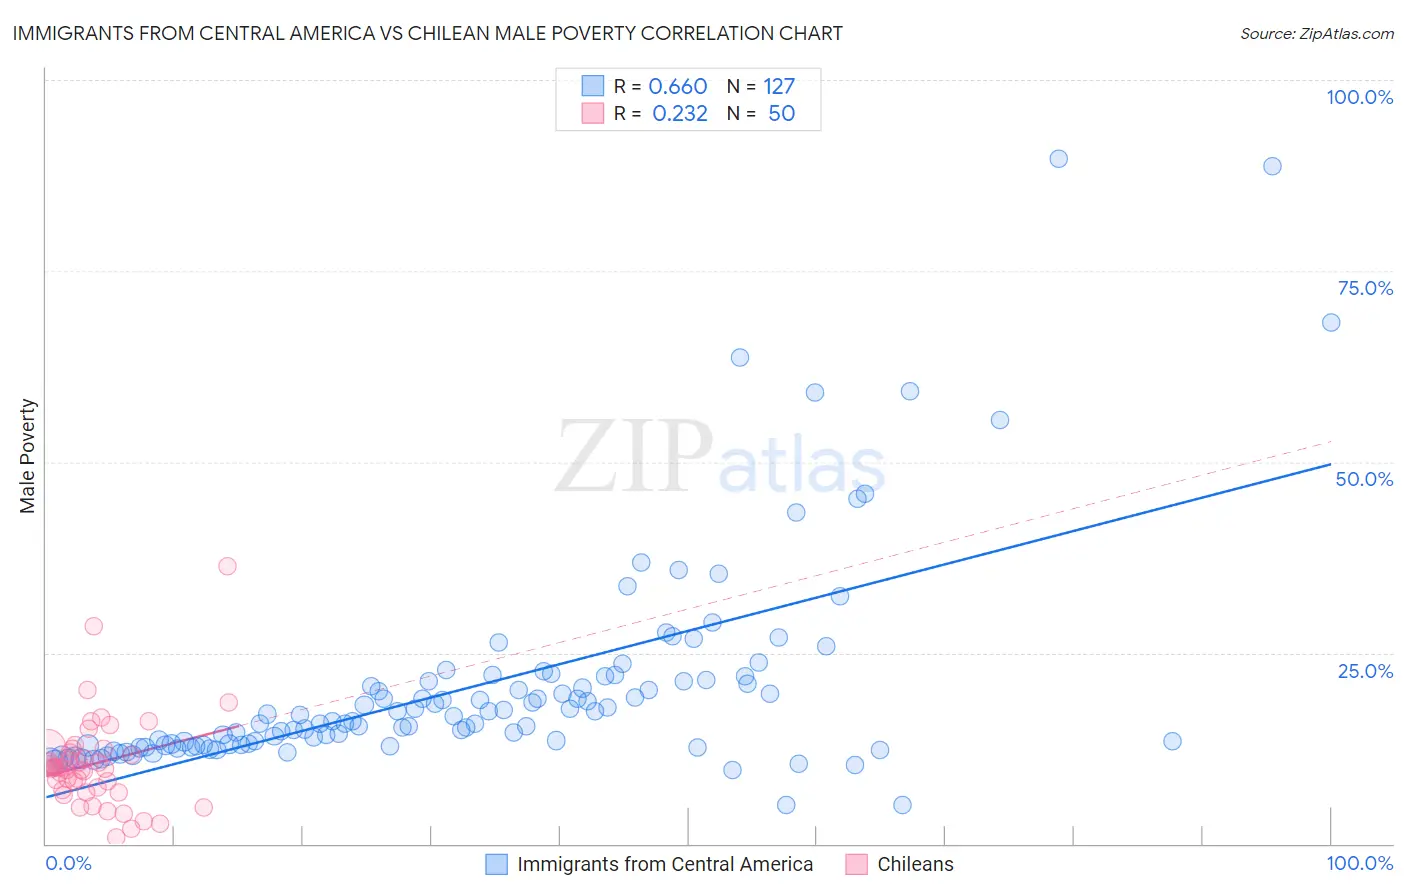
Immigrants from Central America vs Chilean Male Poverty Correlation Chart
The statistical analysis conducted on geographies consisting of 535,621,488 people shows a significant positive correlation between the proportion of Immigrants from Central America and poverty level among males in the United States with a correlation coefficient (R) of 0.660 and weighted average of 13.9%. Similarly, the statistical analysis conducted on geographies consisting of 256,512,426 people shows a weak positive correlation between the proportion of Chileans and poverty level among males in the United States with a correlation coefficient (R) of 0.232 and weighted average of 10.7%, a difference of 29.4%.
Male Poverty Correlation Summary
| Measurement | Immigrants from Central America | Chilean |
| Minimum | 5.0% | 0.80% |
| Maximum | 89.7% | 36.4% |
| Range | 84.7% | 35.6% |
| Mean | 20.6% | 10.5% |
| Median | 16.1% | 9.9% |
| Interquartile 25% (IQ1) | 12.9% | 7.0% |
| Interquartile 75% (IQ3) | 21.5% | 12.4% |
| Interquartile Range (IQR) | 8.5% | 5.3% |
| Standard Deviation (Sample) | 14.1% | 6.2% |
| Standard Deviation (Population) | 14.0% | 6.1% |
Similar Demographics by Male Poverty
Demographics Similar to Immigrants from Central America by Male Poverty
In terms of male poverty, the demographic groups most similar to Immigrants from Central America are Cajun (13.9%, a difference of 0.11%), Hispanic or Latino (13.9%, a difference of 0.28%), Immigrants from Belize (13.8%, a difference of 0.34%), Indonesian (13.8%, a difference of 0.35%), and Vietnamese (13.8%, a difference of 0.52%).
| Demographics | Rating | Rank | Male Poverty |
| Immigrants | St. Vincent and the Grenadines | 0.0 /100 | #288 | Tragic 13.8% |
| Guatemalans | 0.0 /100 | #289 | Tragic 13.8% |
| Immigrants | Zaire | 0.0 /100 | #290 | Tragic 13.8% |
| Vietnamese | 0.0 /100 | #291 | Tragic 13.8% |
| Indonesians | 0.0 /100 | #292 | Tragic 13.8% |
| Immigrants | Belize | 0.0 /100 | #293 | Tragic 13.8% |
| Hispanics or Latinos | 0.0 /100 | #294 | Tragic 13.9% |
| Immigrants | Central America | 0.0 /100 | #295 | Tragic 13.9% |
| Cajuns | 0.0 /100 | #296 | Tragic 13.9% |
| Inupiat | 0.0 /100 | #297 | Tragic 14.0% |
| Blackfeet | 0.0 /100 | #298 | Tragic 14.0% |
| Immigrants | Guatemala | 0.0 /100 | #299 | Tragic 14.0% |
| Immigrants | Mexico | 0.0 /100 | #300 | Tragic 14.0% |
| Immigrants | Senegal | 0.0 /100 | #301 | Tragic 14.0% |
| Immigrants | Caribbean | 0.0 /100 | #302 | Tragic 14.0% |
Demographics Similar to Chileans by Male Poverty
In terms of male poverty, the demographic groups most similar to Chileans are Immigrants from Peru (10.7%, a difference of 0.050%), Immigrants from Western Europe (10.7%, a difference of 0.060%), Puget Sound Salish (10.7%, a difference of 0.070%), Immigrants from Ukraine (10.7%, a difference of 0.080%), and Immigrants from Belarus (10.7%, a difference of 0.11%).
| Demographics | Rating | Rank | Male Poverty |
| South Africans | 86.8 /100 | #123 | Excellent 10.7% |
| French | 86.7 /100 | #124 | Excellent 10.7% |
| Immigrants | Norway | 86.0 /100 | #125 | Excellent 10.7% |
| Immigrants | Ukraine | 84.3 /100 | #126 | Excellent 10.7% |
| Puget Sound Salish | 84.3 /100 | #127 | Excellent 10.7% |
| Immigrants | Western Europe | 84.2 /100 | #128 | Excellent 10.7% |
| Immigrants | Peru | 84.1 /100 | #129 | Excellent 10.7% |
| Chileans | 83.9 /100 | #130 | Excellent 10.7% |
| Immigrants | Belarus | 83.3 /100 | #131 | Excellent 10.7% |
| Immigrants | Vietnam | 83.0 /100 | #132 | Excellent 10.8% |
| Pakistanis | 83.0 /100 | #133 | Excellent 10.8% |
| New Zealanders | 82.9 /100 | #134 | Excellent 10.8% |
| Brazilians | 82.7 /100 | #135 | Excellent 10.8% |
| Immigrants | Israel | 80.9 /100 | #136 | Excellent 10.8% |
| Immigrants | Switzerland | 79.2 /100 | #137 | Good 10.8% |