Immigrants from Cabo Verde vs British Male Disability
COMPARE
Immigrants from Cabo Verde
British
Male Disability
Male Disability Comparison
Immigrants from Cabo Verde
British
12.8%
MALE DISABILITY
0.0/ 100
METRIC RATING
289th/ 347
METRIC RANK
12.1%
MALE DISABILITY
0.4/ 100
METRIC RATING
254th/ 347
METRIC RANK
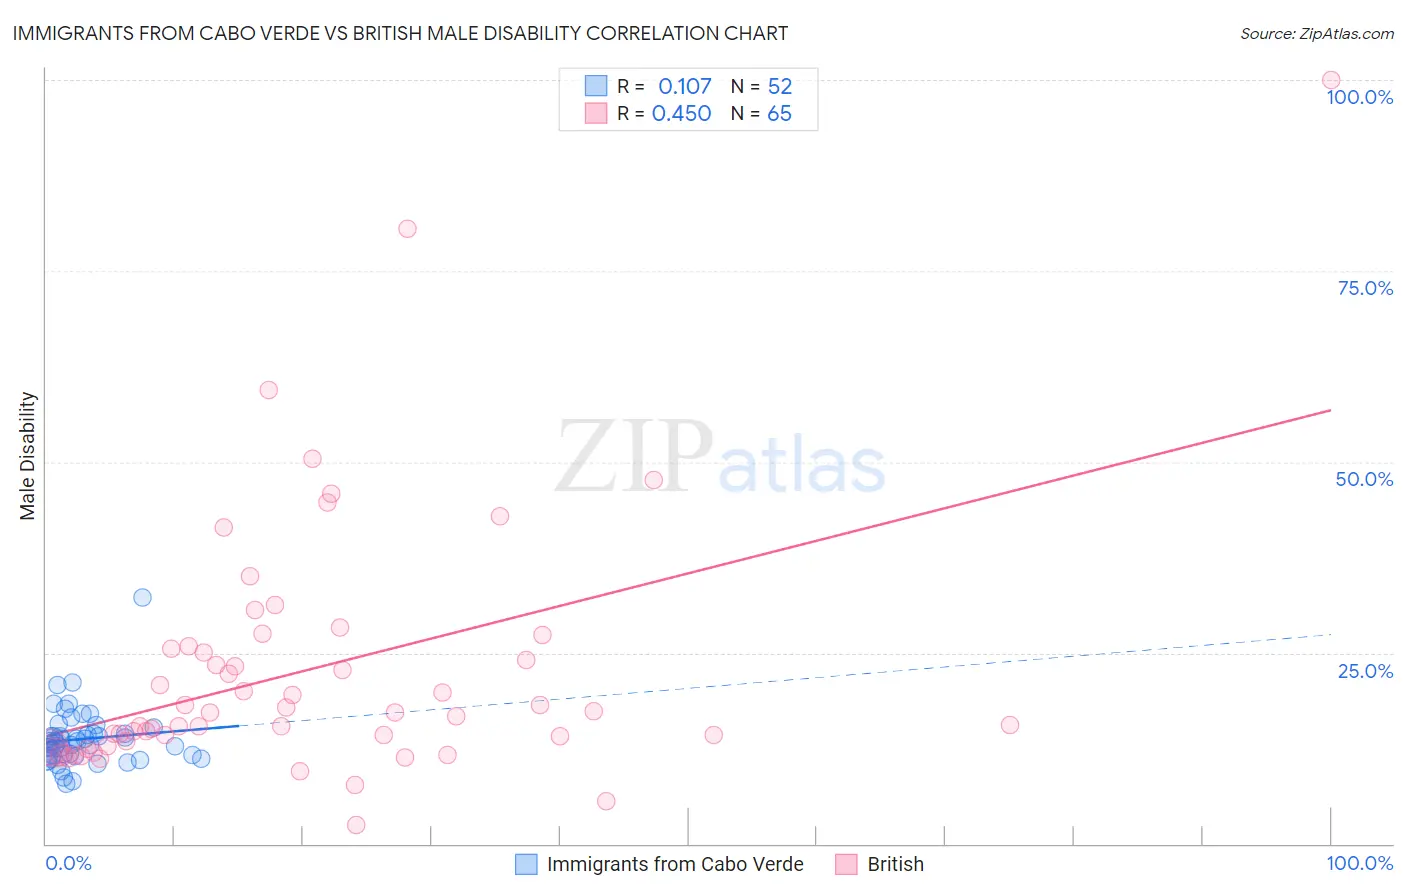
Immigrants from Cabo Verde vs British Male Disability Correlation Chart
The statistical analysis conducted on geographies consisting of 38,149,674 people shows a poor positive correlation between the proportion of Immigrants from Cabo Verde and percentage of males with a disability in the United States with a correlation coefficient (R) of 0.107 and weighted average of 12.8%. Similarly, the statistical analysis conducted on geographies consisting of 531,329,993 people shows a moderate positive correlation between the proportion of British and percentage of males with a disability in the United States with a correlation coefficient (R) of 0.450 and weighted average of 12.1%, a difference of 6.2%.
Male Disability Correlation Summary
| Measurement | Immigrants from Cabo Verde | British |
| Minimum | 7.8% | 2.5% |
| Maximum | 32.3% | 100.0% |
| Range | 24.5% | 97.5% |
| Mean | 13.7% | 22.7% |
| Median | 13.2% | 17.1% |
| Interquartile 25% (IQ1) | 11.5% | 13.2% |
| Interquartile 75% (IQ3) | 14.4% | 25.7% |
| Interquartile Range (IQR) | 3.0% | 12.5% |
| Standard Deviation (Sample) | 3.9% | 16.7% |
| Standard Deviation (Population) | 3.8% | 16.6% |
Similar Demographics by Male Disability
Demographics Similar to Immigrants from Cabo Verde by Male Disability
In terms of male disability, the demographic groups most similar to Immigrants from Cabo Verde are Pima (12.8%, a difference of 0.15%), Yup'ik (12.8%, a difference of 0.19%), White/Caucasian (12.8%, a difference of 0.24%), English (12.8%, a difference of 0.30%), and Cape Verdean (12.8%, a difference of 0.38%).
| Demographics | Rating | Rank | Male Disability |
| Irish | 0.0 /100 | #282 | Tragic 12.7% |
| Germans | 0.0 /100 | #283 | Tragic 12.7% |
| Spanish | 0.0 /100 | #284 | Tragic 12.7% |
| Welsh | 0.0 /100 | #285 | Tragic 12.7% |
| Scottish | 0.0 /100 | #286 | Tragic 12.8% |
| Cape Verdeans | 0.0 /100 | #287 | Tragic 12.8% |
| Yup'ik | 0.0 /100 | #288 | Tragic 12.8% |
| Immigrants | Cabo Verde | 0.0 /100 | #289 | Tragic 12.8% |
| Pima | 0.0 /100 | #290 | Tragic 12.8% |
| Whites/Caucasians | 0.0 /100 | #291 | Tragic 12.8% |
| English | 0.0 /100 | #292 | Tragic 12.8% |
| Yaqui | 0.0 /100 | #293 | Tragic 12.9% |
| Marshallese | 0.0 /100 | #294 | Tragic 12.9% |
| Immigrants | Micronesia | 0.0 /100 | #295 | Tragic 12.9% |
| Immigrants | Nonimmigrants | 0.0 /100 | #296 | Tragic 12.9% |
Demographics Similar to British by Male Disability
In terms of male disability, the demographic groups most similar to British are Chinese (12.1%, a difference of 0.010%), Guamanian/Chamorro (12.0%, a difference of 0.18%), Slovene (12.0%, a difference of 0.19%), German Russian (12.0%, a difference of 0.26%), and Swiss (12.1%, a difference of 0.26%).
| Demographics | Rating | Rank | Male Disability |
| Hungarians | 0.8 /100 | #247 | Tragic 12.0% |
| Poles | 0.7 /100 | #248 | Tragic 12.0% |
| Immigrants | Yemen | 0.5 /100 | #249 | Tragic 12.0% |
| Bangladeshis | 0.5 /100 | #250 | Tragic 12.0% |
| German Russians | 0.5 /100 | #251 | Tragic 12.0% |
| Slovenes | 0.5 /100 | #252 | Tragic 12.0% |
| Guamanians/Chamorros | 0.5 /100 | #253 | Tragic 12.0% |
| British | 0.4 /100 | #254 | Tragic 12.1% |
| Chinese | 0.4 /100 | #255 | Tragic 12.1% |
| Swiss | 0.3 /100 | #256 | Tragic 12.1% |
| Europeans | 0.3 /100 | #257 | Tragic 12.1% |
| Basques | 0.3 /100 | #258 | Tragic 12.1% |
| Belgians | 0.3 /100 | #259 | Tragic 12.1% |
| Swedes | 0.3 /100 | #260 | Tragic 12.1% |
| Slavs | 0.2 /100 | #261 | Tragic 12.2% |