Immigrants from Cabo Verde vs Immigrants from Cameroon Female Poverty
COMPARE
Immigrants from Cabo Verde
Immigrants from Cameroon
Female Poverty
Female Poverty Comparison
Immigrants from Cabo Verde
Immigrants from Cameroon
16.4%
FEMALE POVERTY
0.0/ 100
METRIC RATING
294th/ 347
METRIC RANK
13.5%
FEMALE POVERTY
42.0/ 100
METRIC RATING
185th/ 347
METRIC RANK
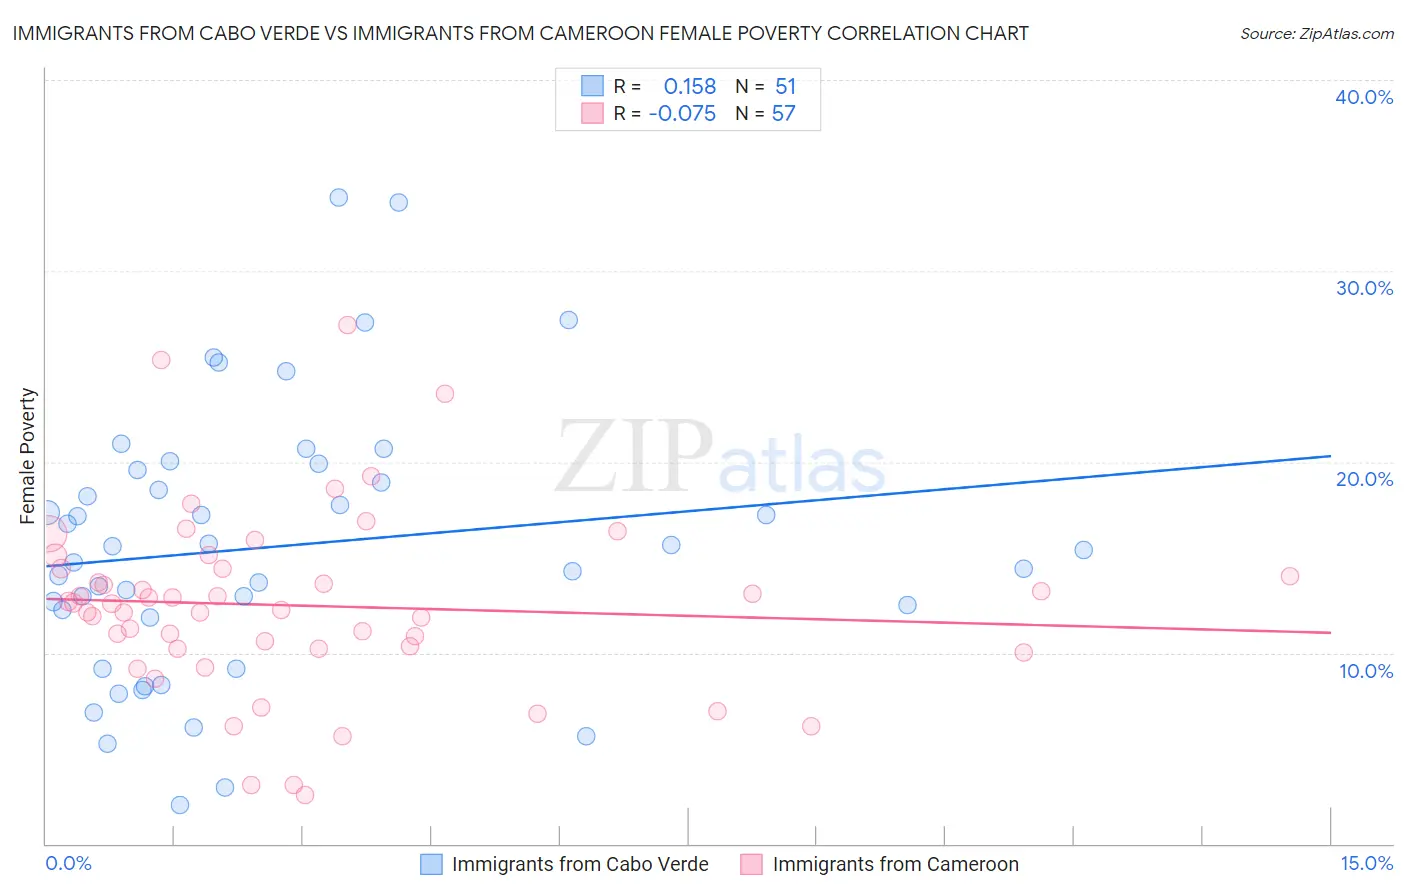
Immigrants from Cabo Verde vs Immigrants from Cameroon Female Poverty Correlation Chart
The statistical analysis conducted on geographies consisting of 38,143,060 people shows a poor positive correlation between the proportion of Immigrants from Cabo Verde and poverty level among females in the United States with a correlation coefficient (R) of 0.158 and weighted average of 16.4%. Similarly, the statistical analysis conducted on geographies consisting of 130,715,237 people shows a slight negative correlation between the proportion of Immigrants from Cameroon and poverty level among females in the United States with a correlation coefficient (R) of -0.075 and weighted average of 13.5%, a difference of 21.4%.
Female Poverty Correlation Summary
| Measurement | Immigrants from Cabo Verde | Immigrants from Cameroon |
| Minimum | 2.0% | 2.6% |
| Maximum | 33.8% | 27.2% |
| Range | 31.8% | 24.6% |
| Mean | 15.6% | 12.5% |
| Median | 15.4% | 12.5% |
| Interquartile 25% (IQ1) | 11.8% | 10.2% |
| Interquartile 75% (IQ3) | 19.6% | 14.4% |
| Interquartile Range (IQR) | 7.7% | 4.2% |
| Standard Deviation (Sample) | 7.1% | 4.8% |
| Standard Deviation (Population) | 7.0% | 4.8% |
Similar Demographics by Female Poverty
Demographics Similar to Immigrants from Cabo Verde by Female Poverty
In terms of female poverty, the demographic groups most similar to Immigrants from Cabo Verde are Immigrants from Latin America (16.4%, a difference of 0.030%), Senegalese (16.5%, a difference of 0.080%), Immigrants from Zaire (16.4%, a difference of 0.090%), Yaqui (16.4%, a difference of 0.10%), and Immigrants from Senegal (16.5%, a difference of 0.10%).
| Demographics | Rating | Rank | Female Poverty |
| Immigrants | Belize | 0.0 /100 | #287 | Tragic 16.3% |
| Indonesians | 0.0 /100 | #288 | Tragic 16.4% |
| Blackfeet | 0.0 /100 | #289 | Tragic 16.4% |
| Immigrants | Bangladesh | 0.0 /100 | #290 | Tragic 16.4% |
| Yaqui | 0.0 /100 | #291 | Tragic 16.4% |
| Immigrants | Zaire | 0.0 /100 | #292 | Tragic 16.4% |
| Immigrants | Latin America | 0.0 /100 | #293 | Tragic 16.4% |
| Immigrants | Cabo Verde | 0.0 /100 | #294 | Tragic 16.4% |
| Senegalese | 0.0 /100 | #295 | Tragic 16.5% |
| Immigrants | Senegal | 0.0 /100 | #296 | Tragic 16.5% |
| Mexicans | 0.0 /100 | #297 | Tragic 16.5% |
| Somalis | 0.0 /100 | #298 | Tragic 16.6% |
| Hispanics or Latinos | 0.0 /100 | #299 | Tragic 16.6% |
| Bahamians | 0.0 /100 | #300 | Tragic 16.6% |
| Guatemalans | 0.0 /100 | #301 | Tragic 16.7% |
Demographics Similar to Immigrants from Cameroon by Female Poverty
In terms of female poverty, the demographic groups most similar to Immigrants from Cameroon are Immigrants from Portugal (13.6%, a difference of 0.060%), Immigrants from Sierra Leone (13.5%, a difference of 0.11%), Immigrants from Venezuela (13.6%, a difference of 0.11%), Kenyan (13.5%, a difference of 0.17%), and Hawaiian (13.6%, a difference of 0.21%).
| Demographics | Rating | Rank | Female Poverty |
| Israelis | 49.1 /100 | #178 | Average 13.5% |
| Immigrants | Syria | 48.8 /100 | #179 | Average 13.5% |
| South Americans | 44.8 /100 | #180 | Average 13.5% |
| Venezuelans | 44.5 /100 | #181 | Average 13.5% |
| Immigrants | Colombia | 44.5 /100 | #182 | Average 13.5% |
| Kenyans | 43.8 /100 | #183 | Average 13.5% |
| Immigrants | Sierra Leone | 43.2 /100 | #184 | Average 13.5% |
| Immigrants | Cameroon | 42.0 /100 | #185 | Average 13.5% |
| Immigrants | Portugal | 41.5 /100 | #186 | Average 13.6% |
| Immigrants | Venezuela | 41.0 /100 | #187 | Average 13.6% |
| Hawaiians | 39.9 /100 | #188 | Fair 13.6% |
| Uruguayans | 39.8 /100 | #189 | Fair 13.6% |
| Sierra Leoneans | 33.1 /100 | #190 | Fair 13.7% |
| Immigrants | Kuwait | 32.7 /100 | #191 | Fair 13.7% |
| Immigrants | Costa Rica | 31.9 /100 | #192 | Fair 13.7% |