Immigrants from Cabo Verde vs African Disability Age 18 to 34
COMPARE
Immigrants from Cabo Verde
African
Disability Age 18 to 34
Disability Age 18 to 34 Comparison
Immigrants from Cabo Verde
Africans
7.7%
DISABILITY AGE 18 TO 34
0.0/ 100
METRIC RATING
294th/ 347
METRIC RANK
7.4%
DISABILITY AGE 18 TO 34
0.1/ 100
METRIC RATING
274th/ 347
METRIC RANK
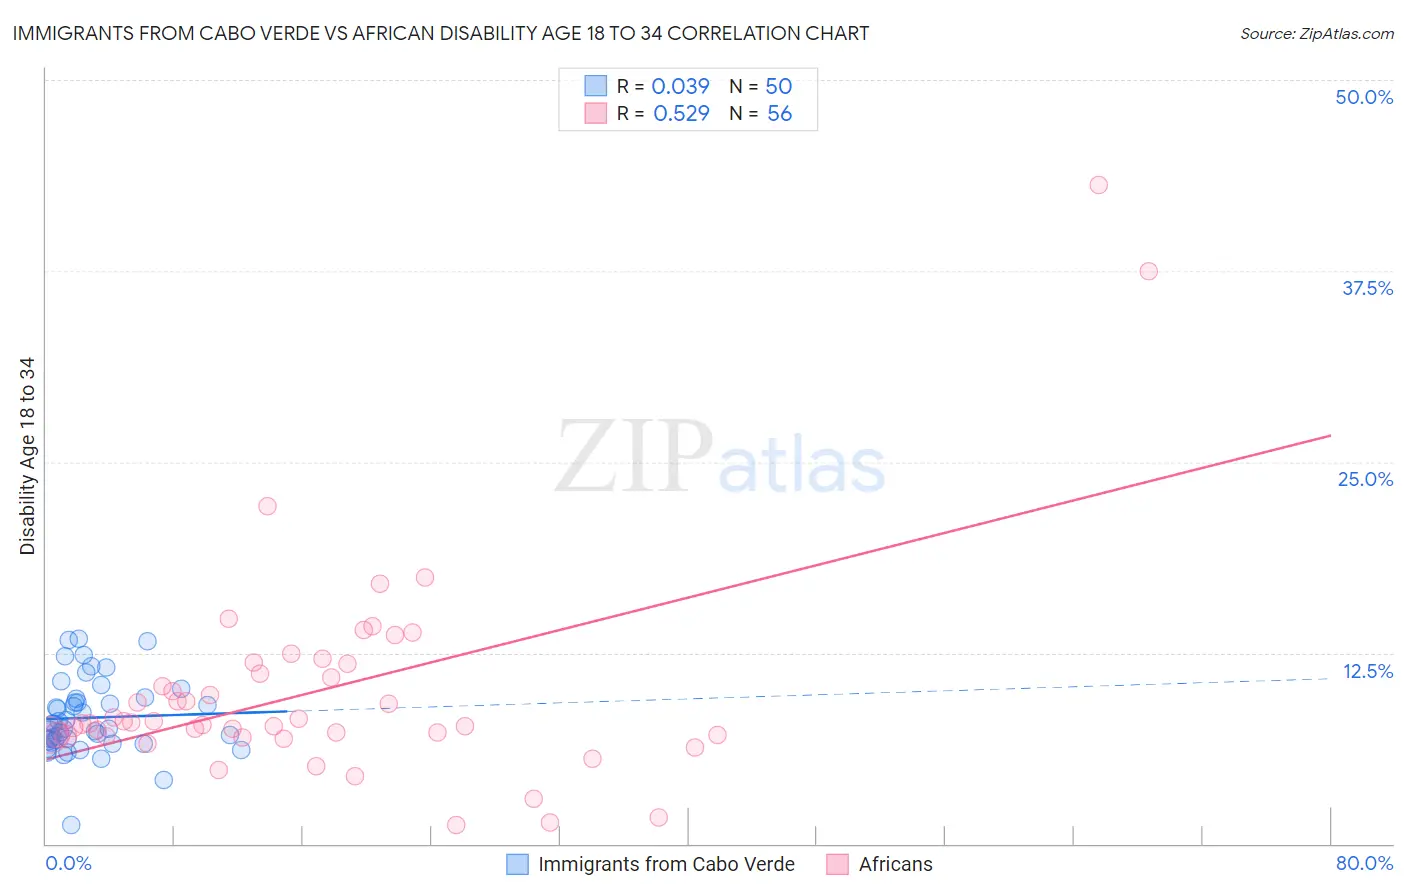
Immigrants from Cabo Verde vs African Disability Age 18 to 34 Correlation Chart
The statistical analysis conducted on geographies consisting of 38,041,178 people shows no correlation between the proportion of Immigrants from Cabo Verde and percentage of population with a disability between the ages 18 and 35 in the United States with a correlation coefficient (R) of 0.039 and weighted average of 7.7%. Similarly, the statistical analysis conducted on geographies consisting of 468,886,209 people shows a substantial positive correlation between the proportion of Africans and percentage of population with a disability between the ages 18 and 35 in the United States with a correlation coefficient (R) of 0.529 and weighted average of 7.4%, a difference of 4.0%.
Disability Age 18 to 34 Correlation Summary
| Measurement | Immigrants from Cabo Verde | African |
| Minimum | 1.2% | 1.2% |
| Maximum | 13.4% | 43.1% |
| Range | 12.2% | 41.9% |
| Mean | 8.3% | 10.0% |
| Median | 7.7% | 7.9% |
| Interquartile 25% (IQ1) | 6.8% | 7.1% |
| Interquartile 75% (IQ3) | 9.5% | 11.4% |
| Interquartile Range (IQR) | 2.8% | 4.4% |
| Standard Deviation (Sample) | 2.4% | 7.1% |
| Standard Deviation (Population) | 2.4% | 7.0% |
Demographics Similar to Immigrants from Cabo Verde and Africans by Disability Age 18 to 34
In terms of disability age 18 to 34, the demographic groups most similar to Immigrants from Cabo Verde are Scandinavian (7.7%, a difference of 0.15%), Black/African American (7.7%, a difference of 0.21%), Irish (7.7%, a difference of 0.44%), Slovak (7.7%, a difference of 0.48%), and Nonimmigrants (7.6%, a difference of 0.57%). Similarly, the demographic groups most similar to Africans are Immigrants from Somalia (7.4%, a difference of 0.070%), European (7.4%, a difference of 0.12%), Immigrants from Portugal (7.4%, a difference of 0.56%), Lumbee (7.4%, a difference of 0.58%), and Czechoslovakian (7.4%, a difference of 0.62%).
| Demographics | Rating | Rank | Disability Age 18 to 34 |
| Africans | 0.1 /100 | #274 | Tragic 7.4% |
| Immigrants | Somalia | 0.1 /100 | #275 | Tragic 7.4% |
| Europeans | 0.1 /100 | #276 | Tragic 7.4% |
| Immigrants | Portugal | 0.1 /100 | #277 | Tragic 7.4% |
| Lumbee | 0.1 /100 | #278 | Tragic 7.4% |
| Czechoslovakians | 0.1 /100 | #279 | Tragic 7.4% |
| Yaqui | 0.1 /100 | #280 | Tragic 7.4% |
| Paiute | 0.0 /100 | #281 | Tragic 7.5% |
| Spanish | 0.0 /100 | #282 | Tragic 7.5% |
| Danes | 0.0 /100 | #283 | Tragic 7.5% |
| Hopi | 0.0 /100 | #284 | Tragic 7.5% |
| Swedes | 0.0 /100 | #285 | Tragic 7.5% |
| Celtics | 0.0 /100 | #286 | Tragic 7.6% |
| Norwegians | 0.0 /100 | #287 | Tragic 7.6% |
| Whites/Caucasians | 0.0 /100 | #288 | Tragic 7.6% |
| Immigrants | Nonimmigrants | 0.0 /100 | #289 | Tragic 7.6% |
| Slovaks | 0.0 /100 | #290 | Tragic 7.7% |
| Irish | 0.0 /100 | #291 | Tragic 7.7% |
| Blacks/African Americans | 0.0 /100 | #292 | Tragic 7.7% |
| Scandinavians | 0.0 /100 | #293 | Tragic 7.7% |
| Immigrants | Cabo Verde | 0.0 /100 | #294 | Tragic 7.7% |