Bulgarian vs Native/Alaskan Single Mother Poverty
COMPARE
Bulgarian
Native/Alaskan
Single Mother Poverty
Single Mother Poverty Comparison
Bulgarians
Natives/Alaskans
26.5%
SINGLE MOTHER POVERTY
99.9/ 100
METRIC RATING
33rd/ 347
METRIC RANK
36.6%
SINGLE MOTHER POVERTY
0.0/ 100
METRIC RATING
330th/ 347
METRIC RANK
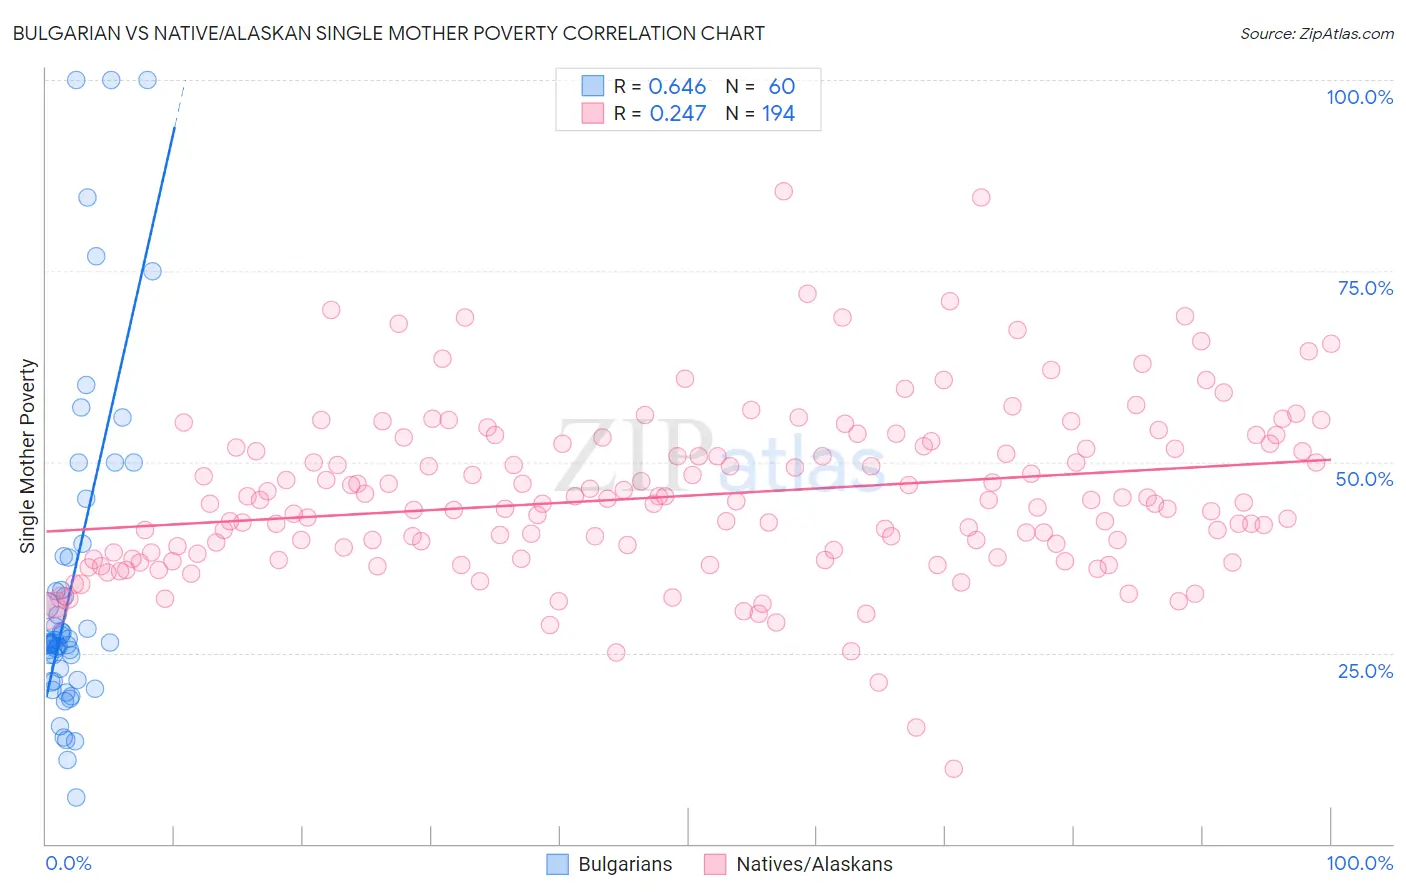
Bulgarian vs Native/Alaskan Single Mother Poverty Correlation Chart
The statistical analysis conducted on geographies consisting of 202,203,367 people shows a significant positive correlation between the proportion of Bulgarians and poverty level among single mothers in the United States with a correlation coefficient (R) of 0.646 and weighted average of 26.5%. Similarly, the statistical analysis conducted on geographies consisting of 497,815,701 people shows a weak positive correlation between the proportion of Natives/Alaskans and poverty level among single mothers in the United States with a correlation coefficient (R) of 0.247 and weighted average of 36.6%, a difference of 38.0%.
Single Mother Poverty Correlation Summary
| Measurement | Bulgarian | Native/Alaskan |
| Minimum | 6.1% | 9.8% |
| Maximum | 100.0% | 85.4% |
| Range | 93.9% | 75.6% |
| Mean | 34.4% | 45.6% |
| Median | 26.4% | 44.6% |
| Interquartile 25% (IQ1) | 22.1% | 37.9% |
| Interquartile 75% (IQ3) | 37.5% | 52.0% |
| Interquartile Range (IQR) | 15.4% | 14.1% |
| Standard Deviation (Sample) | 21.8% | 11.2% |
| Standard Deviation (Population) | 21.6% | 11.2% |
Similar Demographics by Single Mother Poverty
Demographics Similar to Bulgarians by Single Mother Poverty
In terms of single mother poverty, the demographic groups most similar to Bulgarians are Immigrants from Indonesia (26.6%, a difference of 0.010%), Tongan (26.5%, a difference of 0.040%), Maltese (26.6%, a difference of 0.13%), Okinawan (26.6%, a difference of 0.18%), and Immigrants from Israel (26.6%, a difference of 0.18%).
| Demographics | Rating | Rank | Single Mother Poverty |
| Immigrants | Sri Lanka | 100.0 /100 | #26 | Exceptional 26.3% |
| Immigrants | Japan | 100.0 /100 | #27 | Exceptional 26.4% |
| Koreans | 100.0 /100 | #28 | Exceptional 26.4% |
| Jordanians | 100.0 /100 | #29 | Exceptional 26.4% |
| Turks | 100.0 /100 | #30 | Exceptional 26.4% |
| Immigrants | Philippines | 100.0 /100 | #31 | Exceptional 26.5% |
| Tongans | 99.9 /100 | #32 | Exceptional 26.5% |
| Bulgarians | 99.9 /100 | #33 | Exceptional 26.5% |
| Immigrants | Indonesia | 99.9 /100 | #34 | Exceptional 26.6% |
| Maltese | 99.9 /100 | #35 | Exceptional 26.6% |
| Okinawans | 99.9 /100 | #36 | Exceptional 26.6% |
| Immigrants | Israel | 99.9 /100 | #37 | Exceptional 26.6% |
| Immigrants | Fiji | 99.9 /100 | #38 | Exceptional 26.6% |
| Sri Lankans | 99.9 /100 | #39 | Exceptional 26.7% |
| Immigrants | Vietnam | 99.9 /100 | #40 | Exceptional 26.7% |
Demographics Similar to Natives/Alaskans by Single Mother Poverty
In terms of single mother poverty, the demographic groups most similar to Natives/Alaskans are Apache (36.6%, a difference of 0.10%), Creek (36.7%, a difference of 0.16%), Dutch West Indian (36.8%, a difference of 0.40%), Choctaw (36.4%, a difference of 0.58%), and Yakama (36.4%, a difference of 0.64%).
| Demographics | Rating | Rank | Single Mother Poverty |
| Kiowa | 0.0 /100 | #323 | Tragic 35.5% |
| Ottawa | 0.0 /100 | #324 | Tragic 35.5% |
| Ute | 0.0 /100 | #325 | Tragic 35.7% |
| Seminole | 0.0 /100 | #326 | Tragic 35.8% |
| Yakama | 0.0 /100 | #327 | Tragic 36.4% |
| Choctaw | 0.0 /100 | #328 | Tragic 36.4% |
| Apache | 0.0 /100 | #329 | Tragic 36.6% |
| Natives/Alaskans | 0.0 /100 | #330 | Tragic 36.6% |
| Creek | 0.0 /100 | #331 | Tragic 36.7% |
| Dutch West Indians | 0.0 /100 | #332 | Tragic 36.8% |
| Menominee | 0.0 /100 | #333 | Tragic 37.1% |
| Pueblo | 0.0 /100 | #334 | Tragic 37.2% |
| Yuman | 0.0 /100 | #335 | Tragic 37.8% |
| Cheyenne | 0.0 /100 | #336 | Tragic 38.5% |
| Immigrants | Yemen | 0.0 /100 | #337 | Tragic 38.5% |