Portuguese vs Native/Alaskan Single Mother Poverty

COMPARE

Portuguese
Race
Ancestry
AfghanAfricanAlaska NativeAlaskan AthabascanAlbanianAleutAlsatianAmericanApacheArabArapahoArgentineanArmenianAssyrian/Chaldean/SyriacAustralianAustrianBahamianBangladeshiBarbadianBasqueBelgianBelizeanBermudanBhutaneseBlackfeetBolivianBrazilianBritishBritish West IndianBulgarianBurmeseCajunCambodianCanadianCape VerdeanCarpatho RusynCelticCentral AmericanCentral American IndianCherokeeCheyenneChickasawChileanChineseChippewaChoctawColombianColvilleComancheCosta RicanCreeCreekCroatianCrowCubanCypriotCzechCzechoslovakianDanishDelawareDominicanDutchDutch West IndianEastern EuropeanEcuadorianEgyptianEnglishEstonianEthiopianEuropeanFijianFilipinoFinnishFrenchFrench American IndianFrench CanadianGermanGerman RussianGhanaianGreekGuamanian/ChamorroGuatemalanGuyaneseHaitianHmongHonduranHopiHoumaHungarianIcelanderIndian (Asian)IndonesianInupiatIranianIraqiIrishIroquoisIsraeliItalianJamaicanJapaneseJordanianKenyanKiowaKoreanLaotianLatvianLebaneseLiberianLithuanianLumbeeLuxembourgerMacedonianMalaysianMalteseMarshalleseMenomineeMexicanMexican American IndianMongolianMoroccanNative HawaiianNavajoNepaleseNew ZealanderNicaraguanNigerianNorthern EuropeanNorwegianOkinawanOsageOttawaPaiutePakistaniPalestinianPanamanianParaguayanPennsylvania GermanPeruvianPimaPolishPortuguesePotawatomiPuebloPuerto RicanPuget Sound SalishRomanianRussianSalvadoranSamoanScandinavianScotch-IrishScottishSeminoleSenegaleseSerbianShoshoneSierra LeoneanSiouxSlavicSlovakSloveneSomaliSouth AfricanSouth AmericanSouth American IndianSoviet UnionSpaniardSpanishSpanish AmericanSpanish American IndianSri LankanSubsaharan AfricanSudaneseSwedishSwissSyrianTaiwaneseThaiTlingit-HaidaTohono O'OdhamTonganTrinidadian and TobagonianTsimshianTurkishU.S. Virgin IslanderUgandanUkrainianUruguayanUteVenezuelanVietnameseWelshWest IndianYakamaYaquiYugoslavianYumanYup'ikZimbabwean
Immigration
NonimmigrantsImmigrantsAfghanistanAfricaAlbaniaArgentinaArmeniaAsiaAustraliaAustriaBahamasBangladeshBarbadosBelarusBelgiumBelizeBoliviaBosnia and HerzegovinaBrazilBulgariaBurma/MyanmarCabo VerdeCambodiaCameroonCanadaCaribbeanCentral AmericaChileChinaColombiaCongoCosta RicaCroatiaCubaCzechoslovakiaDenmarkDominicaDominican RepublicEastern AfricaEastern AsiaEastern EuropeEcuadorEgyptEl SalvadorEnglandEritreaEthiopiaEuropeFijiFranceGermanyGhanaGreeceGrenadaGuatemalaGuyanaHaitiHondurasHong KongHungaryIndiaIndonesiaIranIraqIrelandIsraelItalyJamaicaJapanJordanKazakhstanKenyaKoreaKuwaitLaosLatin AmericaLatviaLebanonLiberiaLithuaniaMalaysiaMexicoMicronesiaMiddle AfricaMoldovaMoroccoNepalNetherlandsNicaraguaNigeriaNorth AmericaNorth MacedoniaNorthern AfricaNorthern EuropeNorwayOceaniaPakistanPanamaPeruPhilippinesPolandPortugalRomaniaRussiaSaudi ArabiaScotlandSenegalSerbiaSierra LeoneSingaporeSomaliaSouth AfricaSouth AmericaSouth Central AsiaSouth Eastern AsiaSouthern EuropeSpainSri LankaSt. Vincent and the GrenadinesSudanSwedenSwitzerlandSyriaTaiwanThailandTrinidad and TobagoTurkeyUgandaUkraineUruguayUzbekistanVenezuelaVietnamWest IndiesWestern AfricaWestern AsiaWestern EuropeYemenZaireZimbabweAzores
Native/Alaskan
Race
Ancestry
AfghanAfricanAlaska NativeAlaskan AthabascanAlbanianAleutAlsatianAmericanApacheArabArapahoArgentineanArmenianAssyrian/Chaldean/SyriacAustralianAustrianBahamianBangladeshiBarbadianBasqueBelgianBelizeanBermudanBhutaneseBlackfeetBolivianBrazilianBritishBritish West IndianBulgarianBurmeseCajunCambodianCanadianCape VerdeanCarpatho RusynCelticCentral AmericanCentral American IndianCherokeeCheyenneChickasawChileanChineseChippewaChoctawColombianColvilleComancheCosta RicanCreeCreekCroatianCrowCubanCypriotCzechCzechoslovakianDanishDelawareDominicanDutchDutch West IndianEastern EuropeanEcuadorianEgyptianEnglishEstonianEthiopianEuropeanFijianFilipinoFinnishFrenchFrench American IndianFrench CanadianGermanGerman RussianGhanaianGreekGuamanian/ChamorroGuatemalanGuyaneseHaitianHmongHonduranHopiHoumaHungarianIcelanderIndian (Asian)IndonesianInupiatIranianIraqiIrishIroquoisIsraeliItalianJamaicanJapaneseJordanianKenyanKiowaKoreanLaotianLatvianLebaneseLiberianLithuanianLumbeeLuxembourgerMacedonianMalaysianMalteseMarshalleseMenomineeMexicanMexican American IndianMongolianMoroccanNative HawaiianNavajoNepaleseNew ZealanderNicaraguanNigerianNorthern EuropeanNorwegianOkinawanOsageOttawaPaiutePakistaniPalestinianPanamanianParaguayanPennsylvania GermanPeruvianPimaPolishPotawatomiPuebloPuerto RicanPuget Sound SalishRomanianRussianSalvadoranSamoanScandinavianScotch-IrishScottishSeminoleSenegaleseSerbianShoshoneSierra LeoneanSiouxSlavicSlovakSloveneSomaliSouth AfricanSouth AmericanSouth American IndianSoviet UnionSpaniardSpanishSpanish AmericanSpanish American IndianSri LankanSubsaharan AfricanSudaneseSwedishSwissSyrianTaiwaneseThaiTlingit-HaidaTohono O'OdhamTonganTrinidadian and TobagonianTsimshianTurkishU.S. Virgin IslanderUgandanUkrainianUruguayanUteVenezuelanVietnameseWelshWest IndianYakamaYaquiYugoslavianYumanYup'ikZimbabwean
Immigration
NonimmigrantsImmigrantsAfghanistanAfricaAlbaniaArgentinaArmeniaAsiaAustraliaAustriaBahamasBangladeshBarbadosBelarusBelgiumBelizeBoliviaBosnia and HerzegovinaBrazilBulgariaBurma/MyanmarCabo VerdeCambodiaCameroonCanadaCaribbeanCentral AmericaChileChinaColombiaCongoCosta RicaCroatiaCubaCzechoslovakiaDenmarkDominicaDominican RepublicEastern AfricaEastern AsiaEastern EuropeEcuadorEgyptEl SalvadorEnglandEritreaEthiopiaEuropeFijiFranceGermanyGhanaGreeceGrenadaGuatemalaGuyanaHaitiHondurasHong KongHungaryIndiaIndonesiaIranIraqIrelandIsraelItalyJamaicaJapanJordanKazakhstanKenyaKoreaKuwaitLaosLatin AmericaLatviaLebanonLiberiaLithuaniaMalaysiaMexicoMicronesiaMiddle AfricaMoldovaMoroccoNepalNetherlandsNicaraguaNigeriaNorth AmericaNorth MacedoniaNorthern AfricaNorthern EuropeNorwayOceaniaPakistanPanamaPeruPhilippinesPolandPortugalRomaniaRussiaSaudi ArabiaScotlandSenegalSerbiaSierra LeoneSingaporeSomaliaSouth AfricaSouth AmericaSouth Central AsiaSouth Eastern AsiaSouthern EuropeSpainSri LankaSt. Vincent and the GrenadinesSudanSwedenSwitzerlandSyriaTaiwanThailandTrinidad and TobagoTurkeyUgandaUkraineUruguayUzbekistanVenezuelaVietnamWest IndiesWestern AfricaWestern AsiaWestern EuropeYemenZaireZimbabweAzores
Single Mother Poverty
Income
Poverty
Unemployment
Labor Participation
Family Structure
Vehicle Availability
Education Level
Disability

Single Mother Poverty Comparison

Portuguese

Natives/Alaskans

Good
Tragic
28.8%
SINGLE MOTHER POVERTY
73.2/ 100
METRIC RATING
154th/ 347
METRIC RANK
36.6%
SINGLE MOTHER POVERTY
0.0/ 100
METRIC RATING
330th/ 347
METRIC RANK

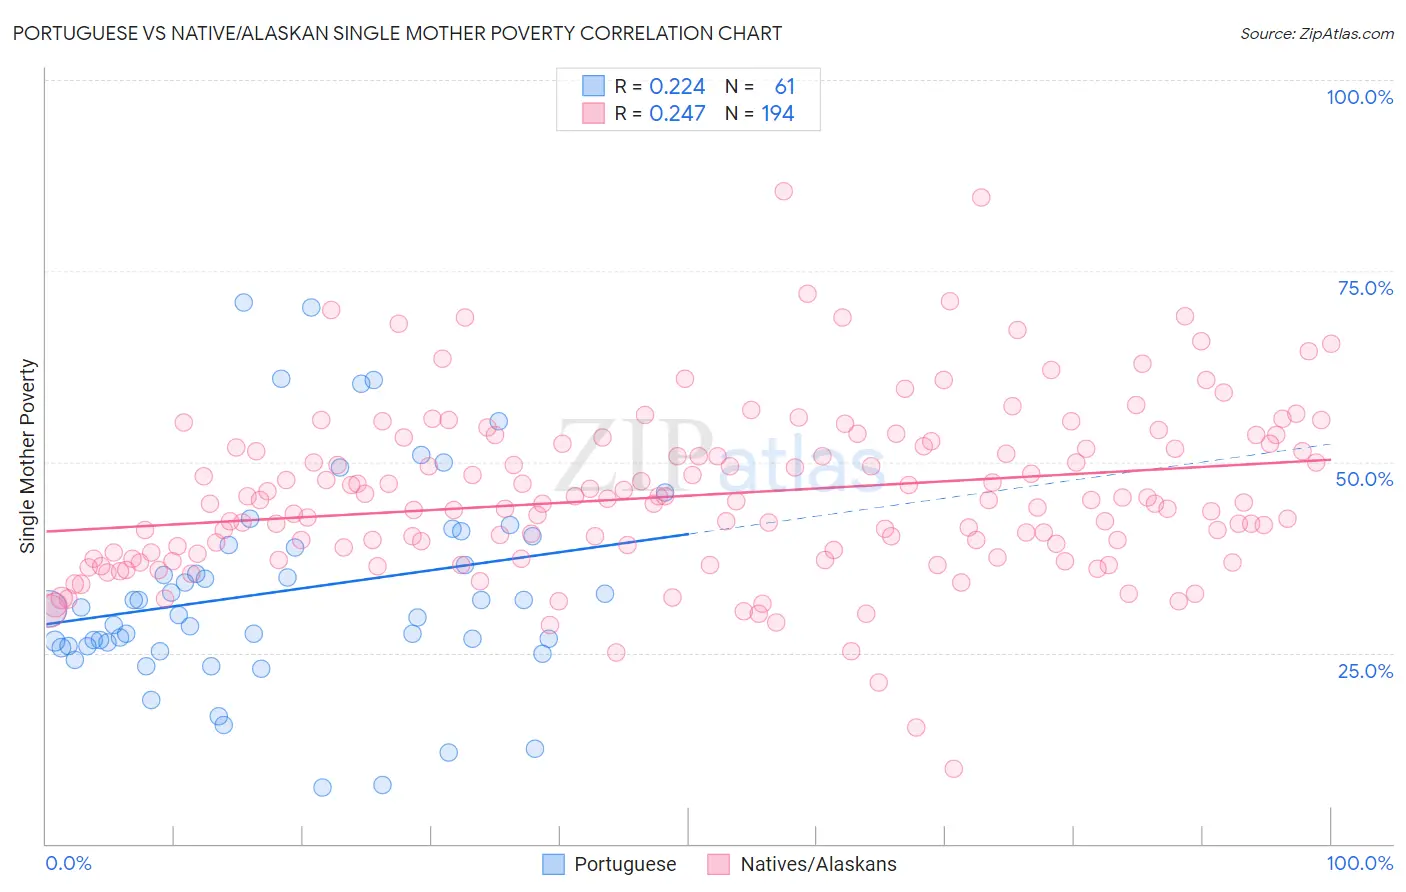
Portuguese vs Native/Alaskan Single Mother Poverty Correlation Chart

The statistical analysis conducted on geographies consisting of 435,396,736 people shows a weak positive correlation between the proportion of Portuguese and poverty level among single mothers in the United States with a correlation coefficient (R) of 0.224 and weighted average of 28.8%. Similarly, the statistical analysis conducted on geographies consisting of 497,815,701 people shows a weak positive correlation between the proportion of Natives/Alaskans and poverty level among single mothers in the United States with a correlation coefficient (R) of 0.247 and weighted average of 36.6%, a difference of 27.1%.
Portuguese vs Native/Alaskan Single Mother Poverty

Single Mother Poverty Correlation Summary

MeasurementPortugueseNative/Alaskan
Minimum7.4%9.8%
Maximum70.8%85.4%
Range63.4%75.6%
Mean33.1%45.6%
Median30.8%44.6%
Interquartile 25% (IQ1)25.9%37.9%
Interquartile 75% (IQ3)39.7%52.0%
Interquartile Range (IQR)13.8%14.1%
Standard Deviation (Sample)13.6%11.2%
Standard Deviation (Population)13.5%11.2%

Similar Demographics by Single Mother Poverty

Demographics Similar to Portuguese by Single Mother Poverty

In terms of single mother poverty, the demographic groups most similar to Portuguese are Ugandan (28.8%, a difference of 0.090%), Iraqi (28.8%, a difference of 0.10%), Immigrants from Western Europe (28.9%, a difference of 0.13%), Immigrants from Hungary (28.9%, a difference of 0.16%), and Slovene (28.8%, a difference of 0.21%).
DemographicsRating | RankSingle Mother Poverty
Immigrants | Lebanon
85.3
/100
|
#147
Excellent
28.6%
Syrians
85.3
/100
|
#148
Excellent
28.6%
Serbians
85.0
/100
|
#149
Excellent
28.6%
Northern Europeans
81.7
/100
|
#150
Excellent
28.6%
Immigrants | Oceania
79.9
/100
|
#151
Good
28.7%
Austrians
79.0
/100
|
#152
Good
28.7%
Slovenes
76.4
/100
|
#153
Good
28.8%
Portuguese
73.2
/100
|
#154
Good
28.8%
Ugandans
71.7
/100
|
#155
Good
28.8%
Iraqis
71.5
/100
|
#156
Good
28.8%
Immigrants | Western Europe
71.1
/100
|
#157
Good
28.9%
Immigrants | Hungary
70.6
/100
|
#158
Good
28.9%
Czechs
68.4
/100
|
#159
Good
28.9%
Japanese
68.0
/100
|
#160
Good
28.9%
Immigrants | Cambodia
66.6
/100
|
#161
Good
28.9%

Demographics Similar to Natives/Alaskans by Single Mother Poverty

In terms of single mother poverty, the demographic groups most similar to Natives/Alaskans are Apache (36.6%, a difference of 0.10%), Creek (36.7%, a difference of 0.16%), Dutch West Indian (36.8%, a difference of 0.40%), Choctaw (36.4%, a difference of 0.58%), and Yakama (36.4%, a difference of 0.64%).
DemographicsRating | RankSingle Mother Poverty
Kiowa
0.0
/100
|
#323
Tragic
35.5%
Ottawa
0.0
/100
|
#324
Tragic
35.5%
Ute
0.0
/100
|
#325
Tragic
35.7%
Seminole
0.0
/100
|
#326
Tragic
35.8%
Yakama
0.0
/100
|
#327
Tragic
36.4%
Choctaw
0.0
/100
|
#328
Tragic
36.4%
Apache
0.0
/100
|
#329
Tragic
36.6%
Natives/Alaskans
0.0
/100
|
#330
Tragic
36.6%
Creek
0.0
/100
|
#331
Tragic
36.7%
Dutch West Indians
0.0
/100
|
#332
Tragic
36.8%
Menominee
0.0
/100
|
#333
Tragic
37.1%
Pueblo
0.0
/100
|
#334
Tragic
37.2%
Yuman
0.0
/100
|
#335
Tragic
37.8%
Cheyenne
0.0
/100
|
#336
Tragic
38.5%
Immigrants | Yemen
0.0
/100
|
#337
Tragic
38.5%