Immigrants from Burma/Myanmar vs Immigrants from Ethiopia Single Mother Poverty
COMPARE
Immigrants from Burma/Myanmar
Immigrants from Ethiopia
Single Mother Poverty
Single Mother Poverty Comparison
Immigrants from Burma/Myanmar
Immigrants from Ethiopia
30.6%
SINGLE MOTHER POVERTY
1.7/ 100
METRIC RATING
242nd/ 347
METRIC RANK
27.7%
SINGLE MOTHER POVERTY
98.4/ 100
METRIC RATING
89th/ 347
METRIC RANK
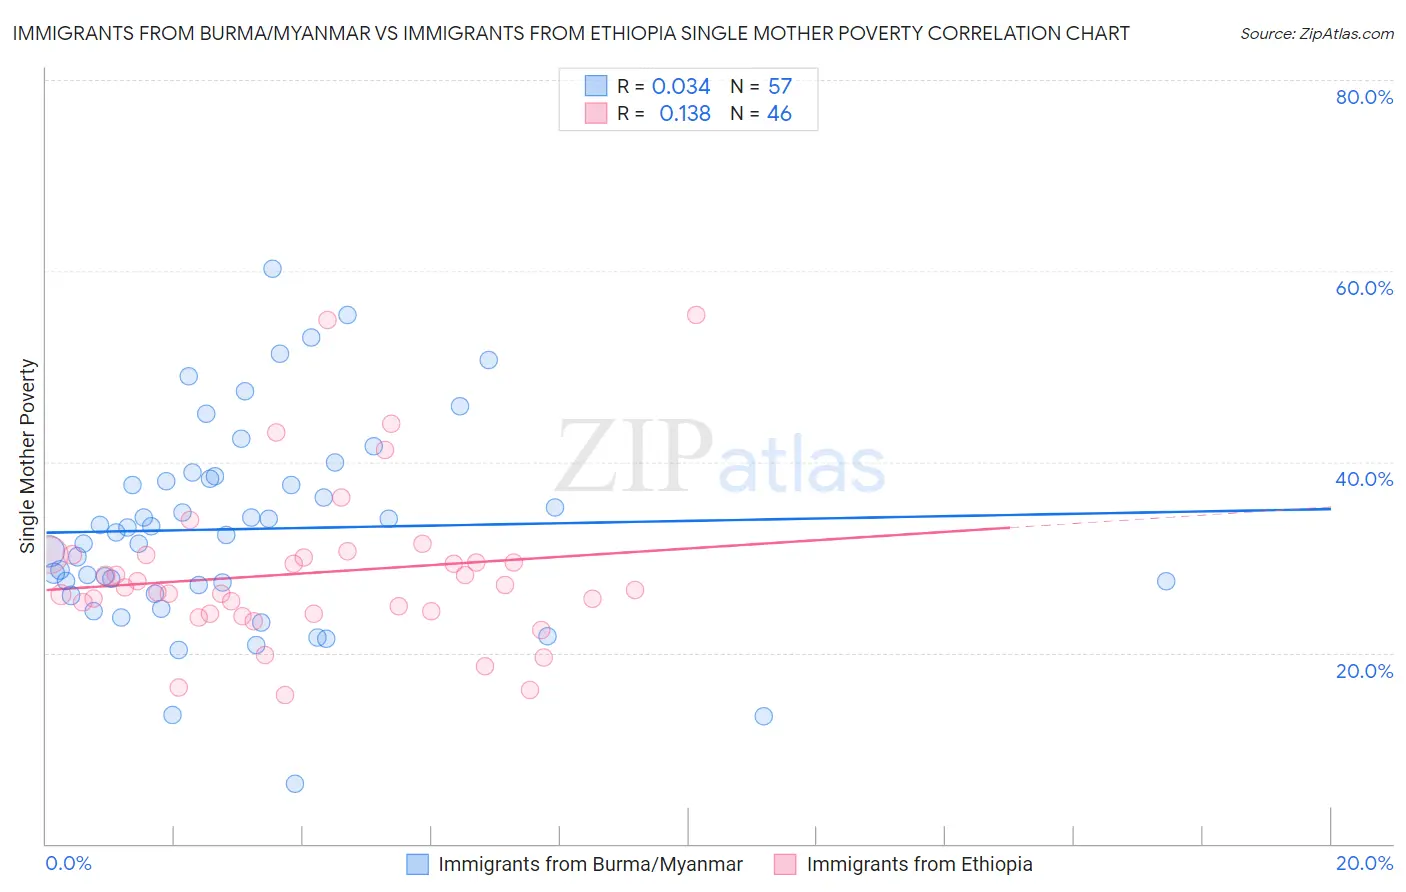
Immigrants from Burma/Myanmar vs Immigrants from Ethiopia Single Mother Poverty Correlation Chart
The statistical analysis conducted on geographies consisting of 170,565,038 people shows no correlation between the proportion of Immigrants from Burma/Myanmar and poverty level among single mothers in the United States with a correlation coefficient (R) of 0.034 and weighted average of 30.6%. Similarly, the statistical analysis conducted on geographies consisting of 209,365,382 people shows a poor positive correlation between the proportion of Immigrants from Ethiopia and poverty level among single mothers in the United States with a correlation coefficient (R) of 0.138 and weighted average of 27.7%, a difference of 10.3%.
Single Mother Poverty Correlation Summary
| Measurement | Immigrants from Burma/Myanmar | Immigrants from Ethiopia |
| Minimum | 6.2% | 15.6% |
| Maximum | 60.3% | 55.4% |
| Range | 54.0% | 39.9% |
| Mean | 33.0% | 28.4% |
| Median | 32.7% | 26.7% |
| Interquartile 25% (IQ1) | 26.6% | 24.1% |
| Interquartile 75% (IQ3) | 38.3% | 30.2% |
| Interquartile Range (IQR) | 11.7% | 6.1% |
| Standard Deviation (Sample) | 10.6% | 8.3% |
| Standard Deviation (Population) | 10.5% | 8.2% |
Similar Demographics by Single Mother Poverty
Demographics Similar to Immigrants from Burma/Myanmar by Single Mother Poverty
In terms of single mother poverty, the demographic groups most similar to Immigrants from Burma/Myanmar are Immigrants from Laos (30.6%, a difference of 0.020%), Salvadoran (30.6%, a difference of 0.070%), Bermudan (30.6%, a difference of 0.080%), Immigrants from Portugal (30.5%, a difference of 0.20%), and French (30.7%, a difference of 0.30%).
| Demographics | Rating | Rank | Single Mother Poverty |
| Immigrants | Grenada | 3.4 /100 | #235 | Tragic 30.3% |
| Welsh | 3.2 /100 | #236 | Tragic 30.4% |
| Immigrants | St. Vincent and the Grenadines | 3.1 /100 | #237 | Tragic 30.4% |
| Slovaks | 2.8 /100 | #238 | Tragic 30.4% |
| Immigrants | Portugal | 2.1 /100 | #239 | Tragic 30.5% |
| Salvadorans | 1.8 /100 | #240 | Tragic 30.6% |
| Immigrants | Laos | 1.8 /100 | #241 | Tragic 30.6% |
| Immigrants | Burma/Myanmar | 1.7 /100 | #242 | Tragic 30.6% |
| Bermudans | 1.6 /100 | #243 | Tragic 30.6% |
| French | 1.3 /100 | #244 | Tragic 30.7% |
| Barbadians | 1.3 /100 | #245 | Tragic 30.7% |
| Ecuadorians | 0.9 /100 | #246 | Tragic 30.8% |
| West Indians | 0.9 /100 | #247 | Tragic 30.8% |
| French Canadians | 0.9 /100 | #248 | Tragic 30.8% |
| Cape Verdeans | 0.8 /100 | #249 | Tragic 30.8% |
Demographics Similar to Immigrants from Ethiopia by Single Mother Poverty
In terms of single mother poverty, the demographic groups most similar to Immigrants from Ethiopia are Ethiopian (27.7%, a difference of 0.020%), Afghan (27.7%, a difference of 0.040%), Immigrants from Ukraine (27.7%, a difference of 0.14%), Immigrants from France (27.8%, a difference of 0.18%), and Immigrants from Latvia (27.7%, a difference of 0.23%).
| Demographics | Rating | Rank | Single Mother Poverty |
| Immigrants | Cameroon | 98.8 /100 | #82 | Exceptional 27.6% |
| Greeks | 98.7 /100 | #83 | Exceptional 27.7% |
| Immigrants | Latvia | 98.7 /100 | #84 | Exceptional 27.7% |
| Mongolians | 98.7 /100 | #85 | Exceptional 27.7% |
| Immigrants | Ukraine | 98.6 /100 | #86 | Exceptional 27.7% |
| Afghans | 98.5 /100 | #87 | Exceptional 27.7% |
| Ethiopians | 98.4 /100 | #88 | Exceptional 27.7% |
| Immigrants | Ethiopia | 98.4 /100 | #89 | Exceptional 27.7% |
| Immigrants | France | 98.2 /100 | #90 | Exceptional 27.8% |
| Immigrants | Albania | 98.0 /100 | #91 | Exceptional 27.8% |
| Estonians | 97.9 /100 | #92 | Exceptional 27.8% |
| Romanians | 97.8 /100 | #93 | Exceptional 27.8% |
| Albanians | 97.6 /100 | #94 | Exceptional 27.9% |
| Chileans | 97.5 /100 | #95 | Exceptional 27.9% |
| Immigrants | Iraq | 97.3 /100 | #96 | Exceptional 27.9% |