Immigrants from Burma/Myanmar vs Immigrants from Fiji Single Mother Poverty
COMPARE
Immigrants from Burma/Myanmar
Immigrants from Fiji
Single Mother Poverty
Single Mother Poverty Comparison
Immigrants from Burma/Myanmar
Immigrants from Fiji
30.6%
SINGLE MOTHER POVERTY
1.7/ 100
METRIC RATING
242nd/ 347
METRIC RANK
26.6%
SINGLE MOTHER POVERTY
99.9/ 100
METRIC RATING
38th/ 347
METRIC RANK
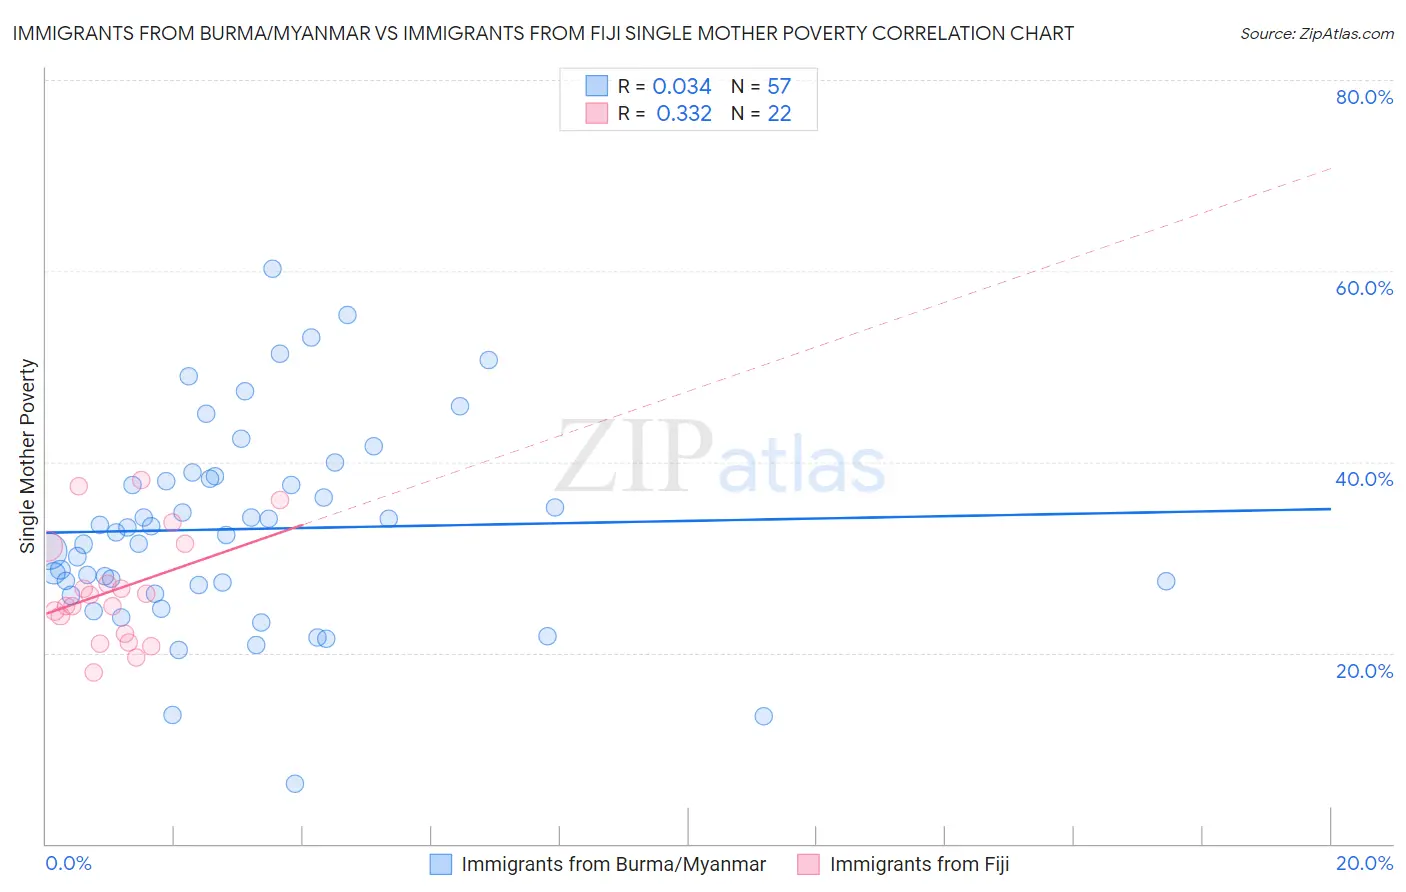
Immigrants from Burma/Myanmar vs Immigrants from Fiji Single Mother Poverty Correlation Chart
The statistical analysis conducted on geographies consisting of 170,565,038 people shows no correlation between the proportion of Immigrants from Burma/Myanmar and poverty level among single mothers in the United States with a correlation coefficient (R) of 0.034 and weighted average of 30.6%. Similarly, the statistical analysis conducted on geographies consisting of 93,178,948 people shows a mild positive correlation between the proportion of Immigrants from Fiji and poverty level among single mothers in the United States with a correlation coefficient (R) of 0.332 and weighted average of 26.6%, a difference of 14.9%.
Single Mother Poverty Correlation Summary
| Measurement | Immigrants from Burma/Myanmar | Immigrants from Fiji |
| Minimum | 6.2% | 18.0% |
| Maximum | 60.3% | 38.1% |
| Range | 54.0% | 20.1% |
| Mean | 33.0% | 26.6% |
| Median | 32.7% | 25.5% |
| Interquartile 25% (IQ1) | 26.6% | 22.0% |
| Interquartile 75% (IQ3) | 38.3% | 31.2% |
| Interquartile Range (IQR) | 11.7% | 9.2% |
| Standard Deviation (Sample) | 10.6% | 5.8% |
| Standard Deviation (Population) | 10.5% | 5.6% |
Similar Demographics by Single Mother Poverty
Demographics Similar to Immigrants from Burma/Myanmar by Single Mother Poverty
In terms of single mother poverty, the demographic groups most similar to Immigrants from Burma/Myanmar are Immigrants from Laos (30.6%, a difference of 0.020%), Salvadoran (30.6%, a difference of 0.070%), Bermudan (30.6%, a difference of 0.080%), Immigrants from Portugal (30.5%, a difference of 0.20%), and French (30.7%, a difference of 0.30%).
| Demographics | Rating | Rank | Single Mother Poverty |
| Immigrants | Grenada | 3.4 /100 | #235 | Tragic 30.3% |
| Welsh | 3.2 /100 | #236 | Tragic 30.4% |
| Immigrants | St. Vincent and the Grenadines | 3.1 /100 | #237 | Tragic 30.4% |
| Slovaks | 2.8 /100 | #238 | Tragic 30.4% |
| Immigrants | Portugal | 2.1 /100 | #239 | Tragic 30.5% |
| Salvadorans | 1.8 /100 | #240 | Tragic 30.6% |
| Immigrants | Laos | 1.8 /100 | #241 | Tragic 30.6% |
| Immigrants | Burma/Myanmar | 1.7 /100 | #242 | Tragic 30.6% |
| Bermudans | 1.6 /100 | #243 | Tragic 30.6% |
| French | 1.3 /100 | #244 | Tragic 30.7% |
| Barbadians | 1.3 /100 | #245 | Tragic 30.7% |
| Ecuadorians | 0.9 /100 | #246 | Tragic 30.8% |
| West Indians | 0.9 /100 | #247 | Tragic 30.8% |
| French Canadians | 0.9 /100 | #248 | Tragic 30.8% |
| Cape Verdeans | 0.8 /100 | #249 | Tragic 30.8% |
Demographics Similar to Immigrants from Fiji by Single Mother Poverty
In terms of single mother poverty, the demographic groups most similar to Immigrants from Fiji are Okinawan (26.6%, a difference of 0.040%), Immigrants from Israel (26.6%, a difference of 0.040%), Maltese (26.6%, a difference of 0.090%), Immigrants from Indonesia (26.6%, a difference of 0.21%), and Bulgarian (26.5%, a difference of 0.22%).
| Demographics | Rating | Rank | Single Mother Poverty |
| Immigrants | Philippines | 100.0 /100 | #31 | Exceptional 26.5% |
| Tongans | 99.9 /100 | #32 | Exceptional 26.5% |
| Bulgarians | 99.9 /100 | #33 | Exceptional 26.5% |
| Immigrants | Indonesia | 99.9 /100 | #34 | Exceptional 26.6% |
| Maltese | 99.9 /100 | #35 | Exceptional 26.6% |
| Okinawans | 99.9 /100 | #36 | Exceptional 26.6% |
| Immigrants | Israel | 99.9 /100 | #37 | Exceptional 26.6% |
| Immigrants | Fiji | 99.9 /100 | #38 | Exceptional 26.6% |
| Sri Lankans | 99.9 /100 | #39 | Exceptional 26.7% |
| Immigrants | Vietnam | 99.9 /100 | #40 | Exceptional 26.7% |
| Immigrants | Greece | 99.9 /100 | #41 | Exceptional 26.7% |
| Armenians | 99.9 /100 | #42 | Exceptional 26.8% |
| Tsimshian | 99.9 /100 | #43 | Exceptional 26.8% |
| Immigrants | Sierra Leone | 99.9 /100 | #44 | Exceptional 26.9% |
| Latvians | 99.9 /100 | #45 | Exceptional 26.9% |