Irish vs Immigrants from Switzerland Poverty
COMPARE
Irish
Immigrants from Switzerland
Poverty
Poverty Comparison
Irish
Immigrants from Switzerland
11.3%
POVERTY
96.6/ 100
METRIC RATING
81st/ 347
METRIC RANK
11.8%
POVERTY
83.0/ 100
METRIC RATING
137th/ 347
METRIC RANK
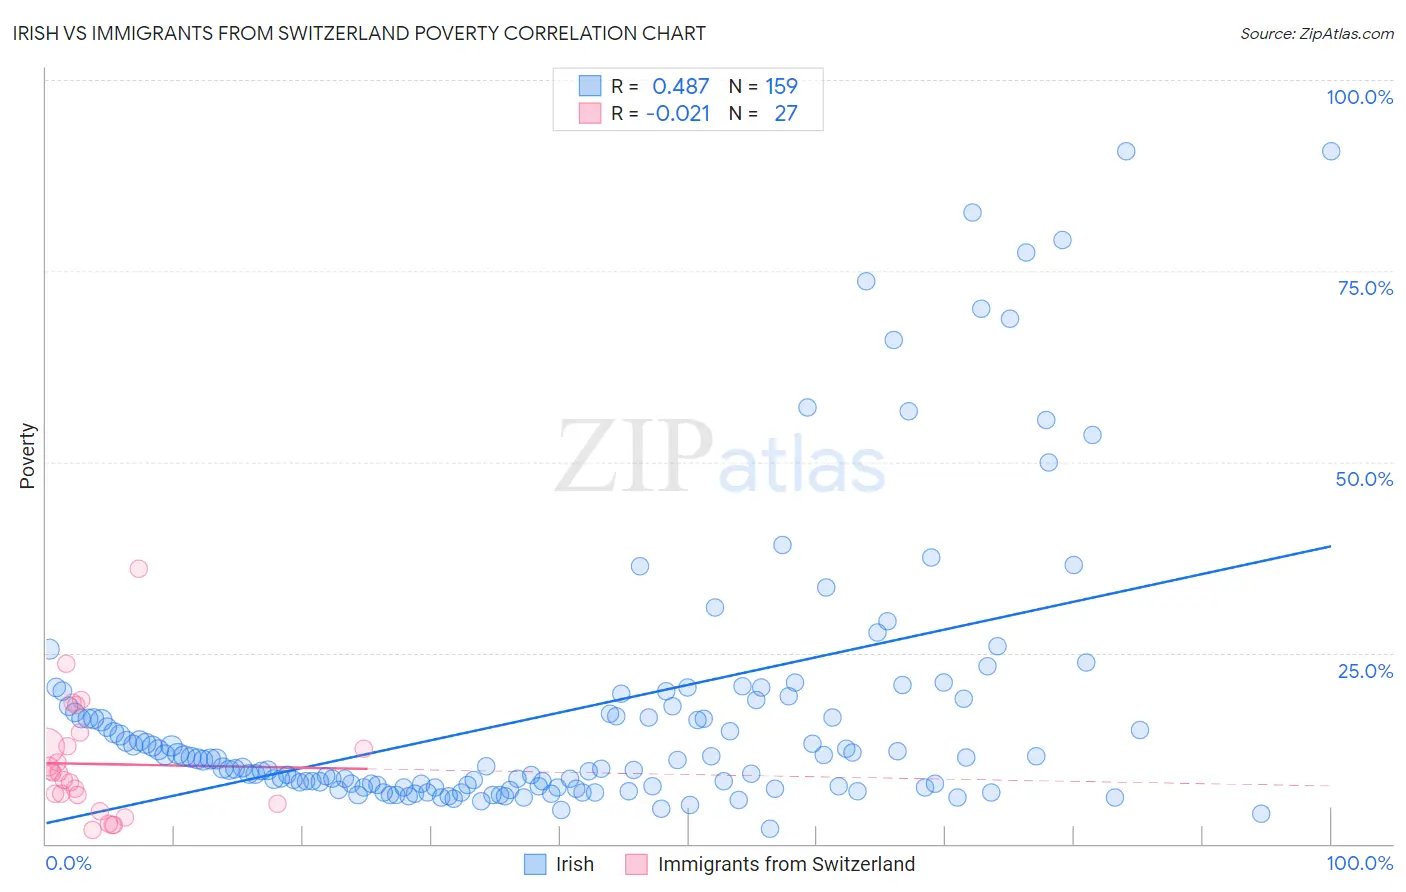
Irish vs Immigrants from Switzerland Poverty Correlation Chart
The statistical analysis conducted on geographies consisting of 579,456,030 people shows a moderate positive correlation between the proportion of Irish and poverty level in the United States with a correlation coefficient (R) of 0.487 and weighted average of 11.3%. Similarly, the statistical analysis conducted on geographies consisting of 148,064,410 people shows no correlation between the proportion of Immigrants from Switzerland and poverty level in the United States with a correlation coefficient (R) of -0.021 and weighted average of 11.8%, a difference of 4.7%.
Poverty Correlation Summary
| Measurement | Irish | Immigrants from Switzerland |
| Minimum | 2.0% | 1.7% |
| Maximum | 90.7% | 36.1% |
| Range | 88.7% | 34.3% |
| Mean | 17.4% | 10.4% |
| Median | 11.0% | 9.3% |
| Interquartile 25% (IQ1) | 7.5% | 5.3% |
| Interquartile 75% (IQ3) | 18.1% | 12.8% |
| Interquartile Range (IQR) | 10.6% | 7.6% |
| Standard Deviation (Sample) | 18.1% | 7.6% |
| Standard Deviation (Population) | 18.0% | 7.5% |
Similar Demographics by Poverty
Demographics Similar to Irish by Poverty
In terms of poverty, the demographic groups most similar to Irish are Indian (Asian) (11.3%, a difference of 0.0%), Cambodian (11.3%, a difference of 0.020%), Dutch (11.3%, a difference of 0.070%), Immigrants from Eastern Asia (11.3%, a difference of 0.080%), and Egyptian (11.3%, a difference of 0.090%).
| Demographics | Rating | Rank | Poverty |
| Carpatho Rusyns | 97.2 /100 | #74 | Exceptional 11.3% |
| Immigrants | Eastern Europe | 97.0 /100 | #75 | Exceptional 11.3% |
| Immigrants | North America | 96.8 /100 | #76 | Exceptional 11.3% |
| Immigrants | Eastern Asia | 96.7 /100 | #77 | Exceptional 11.3% |
| Dutch | 96.7 /100 | #78 | Exceptional 11.3% |
| Cambodians | 96.7 /100 | #79 | Exceptional 11.3% |
| Indians (Asian) | 96.6 /100 | #80 | Exceptional 11.3% |
| Irish | 96.6 /100 | #81 | Exceptional 11.3% |
| Egyptians | 96.5 /100 | #82 | Exceptional 11.3% |
| Immigrants | Sweden | 96.3 /100 | #83 | Exceptional 11.3% |
| English | 96.3 /100 | #84 | Exceptional 11.3% |
| Immigrants | England | 96.2 /100 | #85 | Exceptional 11.4% |
| Jordanians | 96.0 /100 | #86 | Exceptional 11.4% |
| Northern Europeans | 96.0 /100 | #87 | Exceptional 11.4% |
| Belgians | 95.8 /100 | #88 | Exceptional 11.4% |
Demographics Similar to Immigrants from Switzerland by Poverty
In terms of poverty, the demographic groups most similar to Immigrants from Switzerland are Immigrants from Jordan (11.9%, a difference of 0.11%), Pakistani (11.9%, a difference of 0.14%), Chilean (11.8%, a difference of 0.21%), Immigrants from Peru (11.9%, a difference of 0.33%), and Immigrants from Vietnam (11.8%, a difference of 0.41%).
| Demographics | Rating | Rank | Poverty |
| Immigrants | Ukraine | 86.6 /100 | #130 | Excellent 11.8% |
| French | 86.1 /100 | #131 | Excellent 11.8% |
| Peruvians | 85.6 /100 | #132 | Excellent 11.8% |
| Immigrants | Western Europe | 85.2 /100 | #133 | Excellent 11.8% |
| Yugoslavians | 85.2 /100 | #134 | Excellent 11.8% |
| Immigrants | Vietnam | 85.2 /100 | #135 | Excellent 11.8% |
| Chileans | 84.2 /100 | #136 | Excellent 11.8% |
| Immigrants | Switzerland | 83.0 /100 | #137 | Excellent 11.8% |
| Immigrants | Jordan | 82.4 /100 | #138 | Excellent 11.9% |
| Pakistanis | 82.2 /100 | #139 | Excellent 11.9% |
| Immigrants | Peru | 81.1 /100 | #140 | Excellent 11.9% |
| Immigrants | France | 80.5 /100 | #141 | Excellent 11.9% |
| Basques | 80.4 /100 | #142 | Excellent 11.9% |
| Brazilians | 79.7 /100 | #143 | Good 11.9% |
| Icelanders | 77.9 /100 | #144 | Good 11.9% |