Immigrants from Burma/Myanmar vs Immigrants from Southern Europe Male Poverty
COMPARE
Immigrants from Burma/Myanmar
Immigrants from Southern Europe
Male Poverty
Male Poverty Comparison
Immigrants from Burma/Myanmar
Immigrants from Southern Europe
13.0%
MALE POVERTY
0.1/ 100
METRIC RATING
256th/ 347
METRIC RANK
10.5%
MALE POVERTY
91.3/ 100
METRIC RATING
106th/ 347
METRIC RANK
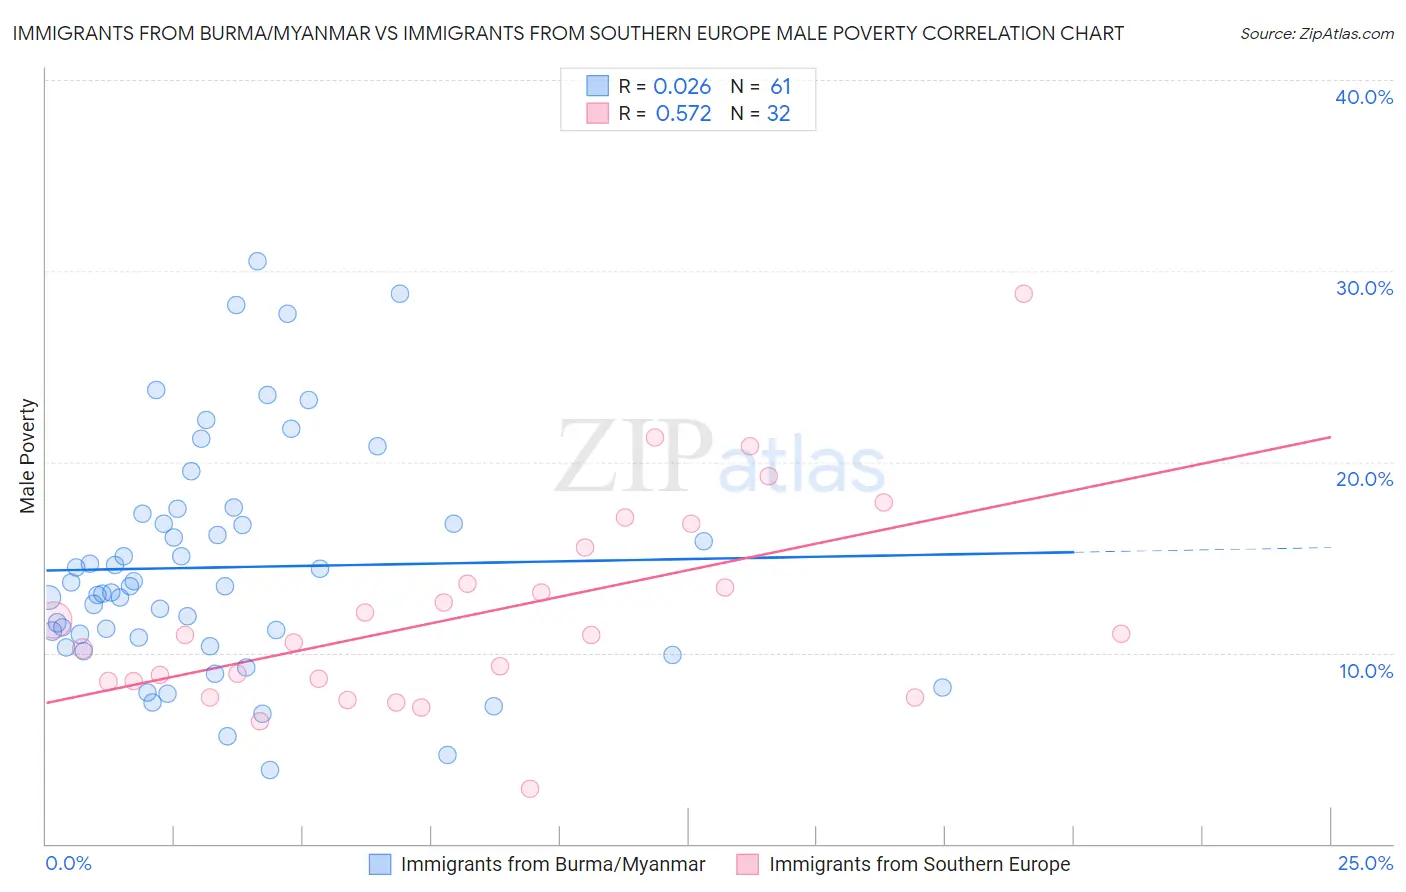
Immigrants from Burma/Myanmar vs Immigrants from Southern Europe Male Poverty Correlation Chart
The statistical analysis conducted on geographies consisting of 172,258,093 people shows no correlation between the proportion of Immigrants from Burma/Myanmar and poverty level among males in the United States with a correlation coefficient (R) of 0.026 and weighted average of 13.0%. Similarly, the statistical analysis conducted on geographies consisting of 402,406,508 people shows a substantial positive correlation between the proportion of Immigrants from Southern Europe and poverty level among males in the United States with a correlation coefficient (R) of 0.572 and weighted average of 10.5%, a difference of 23.5%.
Male Poverty Correlation Summary
| Measurement | Immigrants from Burma/Myanmar | Immigrants from Southern Europe |
| Minimum | 3.9% | 2.9% |
| Maximum | 30.5% | 28.8% |
| Range | 26.6% | 25.9% |
| Mean | 14.5% | 12.1% |
| Median | 13.5% | 10.9% |
| Interquartile 25% (IQ1) | 10.6% | 8.5% |
| Interquartile 75% (IQ3) | 17.0% | 14.6% |
| Interquartile Range (IQR) | 6.5% | 6.1% |
| Standard Deviation (Sample) | 6.0% | 5.4% |
| Standard Deviation (Population) | 5.9% | 5.3% |
Similar Demographics by Male Poverty
Demographics Similar to Immigrants from Burma/Myanmar by Male Poverty
In terms of male poverty, the demographic groups most similar to Immigrants from Burma/Myanmar are Immigrants from Liberia (13.0%, a difference of 0.20%), Immigrants from Trinidad and Tobago (13.1%, a difference of 0.26%), Mexican American Indian (13.0%, a difference of 0.29%), Cape Verdean (13.1%, a difference of 0.39%), and Cherokee (13.1%, a difference of 0.55%).
| Demographics | Rating | Rank | Male Poverty |
| Potawatomi | 0.2 /100 | #249 | Tragic 12.9% |
| Immigrants | Nicaragua | 0.2 /100 | #250 | Tragic 12.9% |
| Immigrants | Cuba | 0.2 /100 | #251 | Tragic 12.9% |
| Immigrants | Ecuador | 0.2 /100 | #252 | Tragic 12.9% |
| Immigrants | Ghana | 0.2 /100 | #253 | Tragic 12.9% |
| Mexican American Indians | 0.1 /100 | #254 | Tragic 13.0% |
| Immigrants | Liberia | 0.1 /100 | #255 | Tragic 13.0% |
| Immigrants | Burma/Myanmar | 0.1 /100 | #256 | Tragic 13.0% |
| Immigrants | Trinidad and Tobago | 0.1 /100 | #257 | Tragic 13.1% |
| Cape Verdeans | 0.1 /100 | #258 | Tragic 13.1% |
| Cherokee | 0.1 /100 | #259 | Tragic 13.1% |
| Ottawa | 0.1 /100 | #260 | Tragic 13.1% |
| Trinidadians and Tobagonians | 0.1 /100 | #261 | Tragic 13.1% |
| Spanish American Indians | 0.1 /100 | #262 | Tragic 13.1% |
| Central Americans | 0.1 /100 | #263 | Tragic 13.2% |
Demographics Similar to Immigrants from Southern Europe by Male Poverty
In terms of male poverty, the demographic groups most similar to Immigrants from Southern Europe are Laotian (10.5%, a difference of 0.010%), Portuguese (10.6%, a difference of 0.080%), Canadian (10.5%, a difference of 0.11%), Welsh (10.5%, a difference of 0.12%), and Slavic (10.5%, a difference of 0.13%).
| Demographics | Rating | Rank | Male Poverty |
| Immigrants | Indonesia | 93.3 /100 | #99 | Exceptional 10.5% |
| Immigrants | Latvia | 92.8 /100 | #100 | Exceptional 10.5% |
| Immigrants | Zimbabwe | 92.0 /100 | #101 | Exceptional 10.5% |
| French Canadians | 91.9 /100 | #102 | Exceptional 10.5% |
| Slavs | 91.7 /100 | #103 | Exceptional 10.5% |
| Welsh | 91.6 /100 | #104 | Exceptional 10.5% |
| Canadians | 91.6 /100 | #105 | Exceptional 10.5% |
| Immigrants | Southern Europe | 91.3 /100 | #106 | Exceptional 10.5% |
| Laotians | 91.2 /100 | #107 | Exceptional 10.5% |
| Portuguese | 91.0 /100 | #108 | Exceptional 10.6% |
| Albanians | 90.6 /100 | #109 | Exceptional 10.6% |
| Argentineans | 90.1 /100 | #110 | Exceptional 10.6% |
| Immigrants | Argentina | 89.8 /100 | #111 | Excellent 10.6% |
| Immigrants | Turkey | 89.5 /100 | #112 | Excellent 10.6% |
| Palestinians | 89.1 /100 | #113 | Excellent 10.6% |