Immigrants from Burma/Myanmar vs Immigrants from Uganda Male Poverty
COMPARE
Immigrants from Burma/Myanmar
Immigrants from Uganda
Male Poverty
Male Poverty Comparison
Immigrants from Burma/Myanmar
Immigrants from Uganda
13.0%
MALE POVERTY
0.1/ 100
METRIC RATING
256th/ 347
METRIC RANK
11.8%
MALE POVERTY
8.5/ 100
METRIC RATING
204th/ 347
METRIC RANK
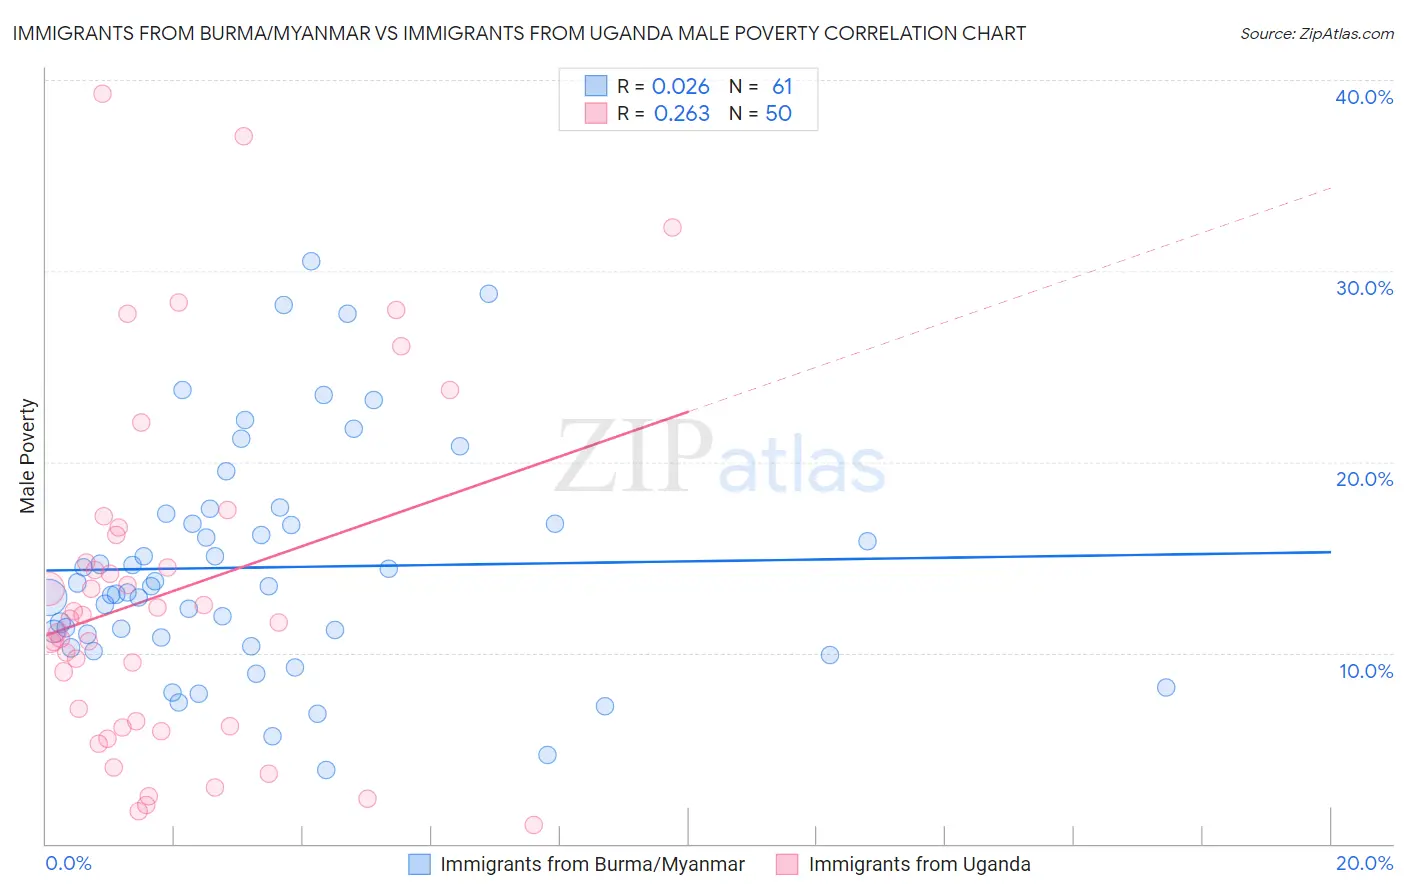
Immigrants from Burma/Myanmar vs Immigrants from Uganda Male Poverty Correlation Chart
The statistical analysis conducted on geographies consisting of 172,258,093 people shows no correlation between the proportion of Immigrants from Burma/Myanmar and poverty level among males in the United States with a correlation coefficient (R) of 0.026 and weighted average of 13.0%. Similarly, the statistical analysis conducted on geographies consisting of 125,960,451 people shows a weak positive correlation between the proportion of Immigrants from Uganda and poverty level among males in the United States with a correlation coefficient (R) of 0.263 and weighted average of 11.8%, a difference of 10.0%.
Male Poverty Correlation Summary
| Measurement | Immigrants from Burma/Myanmar | Immigrants from Uganda |
| Minimum | 3.9% | 0.96% |
| Maximum | 30.5% | 39.3% |
| Range | 26.6% | 38.3% |
| Mean | 14.5% | 13.1% |
| Median | 13.5% | 11.7% |
| Interquartile 25% (IQ1) | 10.6% | 6.2% |
| Interquartile 75% (IQ3) | 17.0% | 16.2% |
| Interquartile Range (IQR) | 6.5% | 10.0% |
| Standard Deviation (Sample) | 6.0% | 9.1% |
| Standard Deviation (Population) | 5.9% | 9.0% |
Similar Demographics by Male Poverty
Demographics Similar to Immigrants from Burma/Myanmar by Male Poverty
In terms of male poverty, the demographic groups most similar to Immigrants from Burma/Myanmar are Immigrants from Liberia (13.0%, a difference of 0.20%), Immigrants from Trinidad and Tobago (13.1%, a difference of 0.26%), Mexican American Indian (13.0%, a difference of 0.29%), Cape Verdean (13.1%, a difference of 0.39%), and Cherokee (13.1%, a difference of 0.55%).
| Demographics | Rating | Rank | Male Poverty |
| Potawatomi | 0.2 /100 | #249 | Tragic 12.9% |
| Immigrants | Nicaragua | 0.2 /100 | #250 | Tragic 12.9% |
| Immigrants | Cuba | 0.2 /100 | #251 | Tragic 12.9% |
| Immigrants | Ecuador | 0.2 /100 | #252 | Tragic 12.9% |
| Immigrants | Ghana | 0.2 /100 | #253 | Tragic 12.9% |
| Mexican American Indians | 0.1 /100 | #254 | Tragic 13.0% |
| Immigrants | Liberia | 0.1 /100 | #255 | Tragic 13.0% |
| Immigrants | Burma/Myanmar | 0.1 /100 | #256 | Tragic 13.0% |
| Immigrants | Trinidad and Tobago | 0.1 /100 | #257 | Tragic 13.1% |
| Cape Verdeans | 0.1 /100 | #258 | Tragic 13.1% |
| Cherokee | 0.1 /100 | #259 | Tragic 13.1% |
| Ottawa | 0.1 /100 | #260 | Tragic 13.1% |
| Trinidadians and Tobagonians | 0.1 /100 | #261 | Tragic 13.1% |
| Spanish American Indians | 0.1 /100 | #262 | Tragic 13.1% |
| Central Americans | 0.1 /100 | #263 | Tragic 13.2% |
Demographics Similar to Immigrants from Uganda by Male Poverty
In terms of male poverty, the demographic groups most similar to Immigrants from Uganda are Immigrants from Western Asia (11.8%, a difference of 0.36%), Aleut (11.8%, a difference of 0.50%), Panamanian (11.9%, a difference of 0.78%), Immigrants from Eastern Africa (12.0%, a difference of 1.1%), and Spaniard (11.7%, a difference of 1.2%).
| Demographics | Rating | Rank | Male Poverty |
| Delaware | 15.4 /100 | #197 | Poor 11.7% |
| Iraqis | 14.7 /100 | #198 | Poor 11.7% |
| Spanish | 14.1 /100 | #199 | Poor 11.7% |
| Immigrants | Lebanon | 13.6 /100 | #200 | Poor 11.7% |
| Spaniards | 13.5 /100 | #201 | Poor 11.7% |
| Aleuts | 10.4 /100 | #202 | Poor 11.8% |
| Immigrants | Western Asia | 9.8 /100 | #203 | Tragic 11.8% |
| Immigrants | Uganda | 8.5 /100 | #204 | Tragic 11.8% |
| Panamanians | 6.2 /100 | #205 | Tragic 11.9% |
| Immigrants | Eastern Africa | 5.4 /100 | #206 | Tragic 12.0% |
| Malaysians | 5.2 /100 | #207 | Tragic 12.0% |
| Immigrants | Immigrants | 4.5 /100 | #208 | Tragic 12.0% |
| Immigrants | Azores | 4.3 /100 | #209 | Tragic 12.0% |
| Moroccans | 4.2 /100 | #210 | Tragic 12.0% |
| Immigrants | Panama | 4.0 /100 | #211 | Tragic 12.1% |