Immigrants from Burma/Myanmar vs Immigrants from Sweden 2nd Grade
COMPARE
Immigrants from Burma/Myanmar
Immigrants from Sweden
2nd Grade
2nd Grade Comparison
Immigrants from Burma/Myanmar
Immigrants from Sweden
96.7%
2ND GRADE
0.0/ 100
METRIC RATING
321st/ 347
METRIC RANK
98.2%
2ND GRADE
99.1/ 100
METRIC RATING
83rd/ 347
METRIC RANK
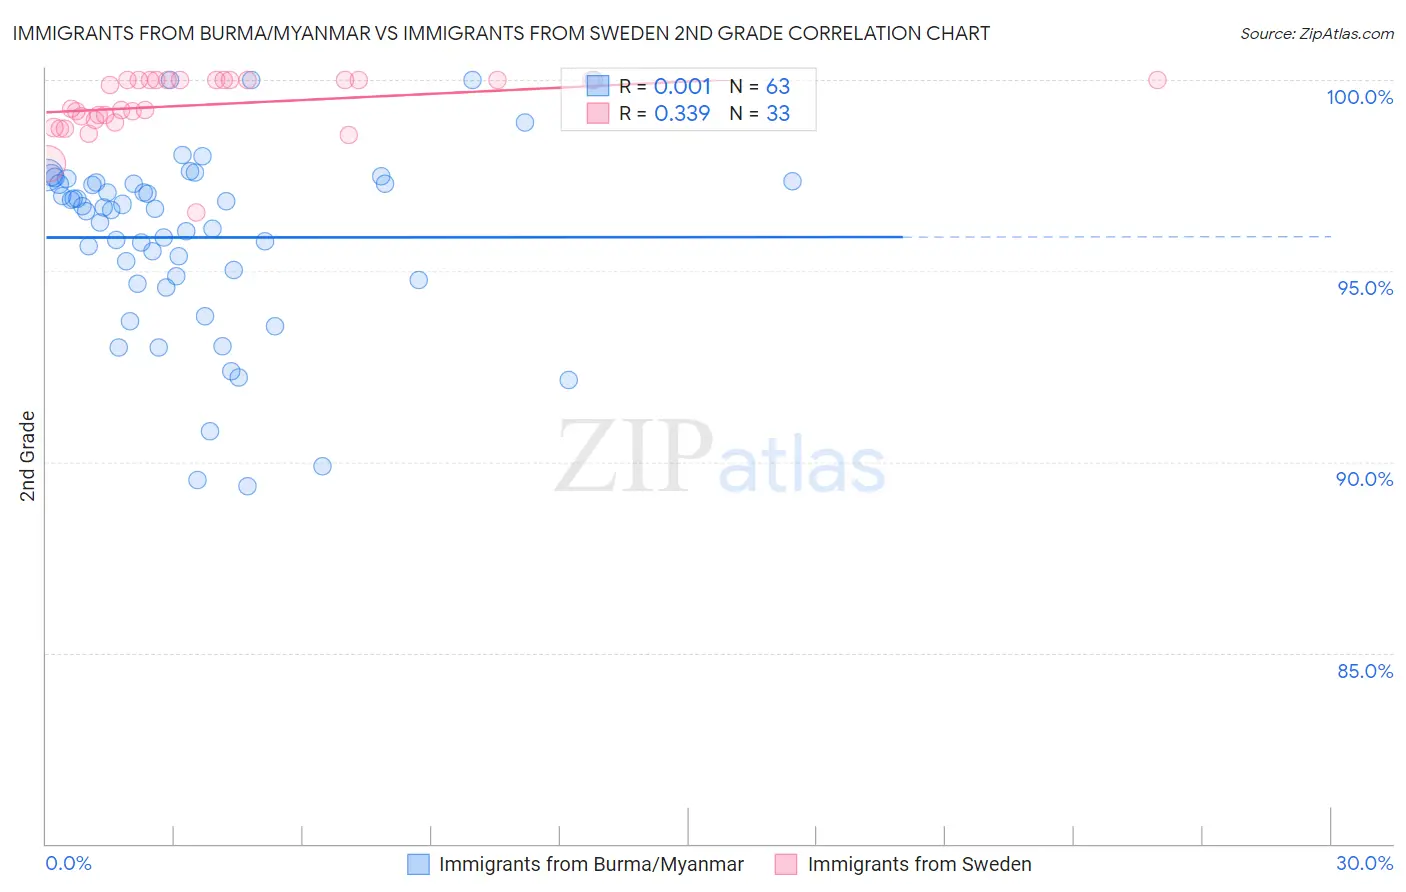
Immigrants from Burma/Myanmar vs Immigrants from Sweden 2nd Grade Correlation Chart
The statistical analysis conducted on geographies consisting of 172,338,093 people shows no correlation between the proportion of Immigrants from Burma/Myanmar and percentage of population with at least 2nd grade education in the United States with a correlation coefficient (R) of 0.001 and weighted average of 96.7%. Similarly, the statistical analysis conducted on geographies consisting of 164,737,092 people shows a mild positive correlation between the proportion of Immigrants from Sweden and percentage of population with at least 2nd grade education in the United States with a correlation coefficient (R) of 0.339 and weighted average of 98.2%, a difference of 1.5%.
2nd Grade Correlation Summary
| Measurement | Immigrants from Burma/Myanmar | Immigrants from Sweden |
| Minimum | 89.4% | 96.5% |
| Maximum | 100.0% | 100.0% |
| Range | 10.6% | 3.5% |
| Mean | 95.9% | 99.4% |
| Median | 96.6% | 99.2% |
| Interquartile 25% (IQ1) | 94.8% | 98.9% |
| Interquartile 75% (IQ3) | 97.3% | 100.0% |
| Interquartile Range (IQR) | 2.5% | 1.1% |
| Standard Deviation (Sample) | 2.4% | 0.79% |
| Standard Deviation (Population) | 2.4% | 0.78% |
Similar Demographics by 2nd Grade
Demographics Similar to Immigrants from Burma/Myanmar by 2nd Grade
In terms of 2nd grade, the demographic groups most similar to Immigrants from Burma/Myanmar are Immigrants from Guyana (96.7%, a difference of 0.0%), Honduran (96.7%, a difference of 0.010%), Immigrants from Laos (96.7%, a difference of 0.010%), Indonesian (96.7%, a difference of 0.010%), and Immigrants from Nicaragua (96.7%, a difference of 0.010%).
| Demographics | Rating | Rank | 2nd Grade |
| Immigrants | Ecuador | 0.0 /100 | #314 | Tragic 96.8% |
| Immigrants | Belize | 0.0 /100 | #315 | Tragic 96.8% |
| Hondurans | 0.0 /100 | #316 | Tragic 96.7% |
| Immigrants | Laos | 0.0 /100 | #317 | Tragic 96.7% |
| Indonesians | 0.0 /100 | #318 | Tragic 96.7% |
| Immigrants | Nicaragua | 0.0 /100 | #319 | Tragic 96.7% |
| Immigrants | Guyana | 0.0 /100 | #320 | Tragic 96.7% |
| Immigrants | Burma/Myanmar | 0.0 /100 | #321 | Tragic 96.7% |
| Immigrants | Bangladesh | 0.0 /100 | #322 | Tragic 96.7% |
| Vietnamese | 0.0 /100 | #323 | Tragic 96.7% |
| Mexican American Indians | 0.0 /100 | #324 | Tragic 96.7% |
| Dominicans | 0.0 /100 | #325 | Tragic 96.6% |
| Immigrants | Honduras | 0.0 /100 | #326 | Tragic 96.6% |
| Immigrants | Vietnam | 0.0 /100 | #327 | Tragic 96.5% |
| Mexicans | 0.0 /100 | #328 | Tragic 96.5% |
Demographics Similar to Immigrants from Sweden by 2nd Grade
In terms of 2nd grade, the demographic groups most similar to Immigrants from Sweden are Delaware (98.2%, a difference of 0.0%), Hopi (98.2%, a difference of 0.0%), Potawatomi (98.2%, a difference of 0.0%), Osage (98.2%, a difference of 0.010%), and Icelander (98.2%, a difference of 0.010%).
| Demographics | Rating | Rank | 2nd Grade |
| Cherokee | 99.4 /100 | #76 | Exceptional 98.3% |
| Immigrants | England | 99.4 /100 | #77 | Exceptional 98.3% |
| Immigrants | Lithuania | 99.3 /100 | #78 | Exceptional 98.2% |
| Immigrants | Belgium | 99.3 /100 | #79 | Exceptional 98.2% |
| Osage | 99.2 /100 | #80 | Exceptional 98.2% |
| Icelanders | 99.2 /100 | #81 | Exceptional 98.2% |
| Delaware | 99.1 /100 | #82 | Exceptional 98.2% |
| Immigrants | Sweden | 99.1 /100 | #83 | Exceptional 98.2% |
| Hopi | 99.1 /100 | #84 | Exceptional 98.2% |
| Potawatomi | 99.1 /100 | #85 | Exceptional 98.2% |
| Immigrants | Australia | 99.0 /100 | #86 | Exceptional 98.2% |
| Immigrants | Denmark | 99.0 /100 | #87 | Exceptional 98.2% |
| Macedonians | 99.0 /100 | #88 | Exceptional 98.2% |
| Ukrainians | 98.9 /100 | #89 | Exceptional 98.2% |
| Zimbabweans | 98.8 /100 | #90 | Exceptional 98.2% |