Immigrants from Belgium vs Immigrants from Western Europe Single Mother Poverty
COMPARE
Immigrants from Belgium
Immigrants from Western Europe
Single Mother Poverty
Single Mother Poverty Comparison
Immigrants from Belgium
Immigrants from Western Europe
28.5%
SINGLE MOTHER POVERTY
88.5/ 100
METRIC RATING
138th/ 347
METRIC RANK
28.9%
SINGLE MOTHER POVERTY
71.1/ 100
METRIC RATING
157th/ 347
METRIC RANK
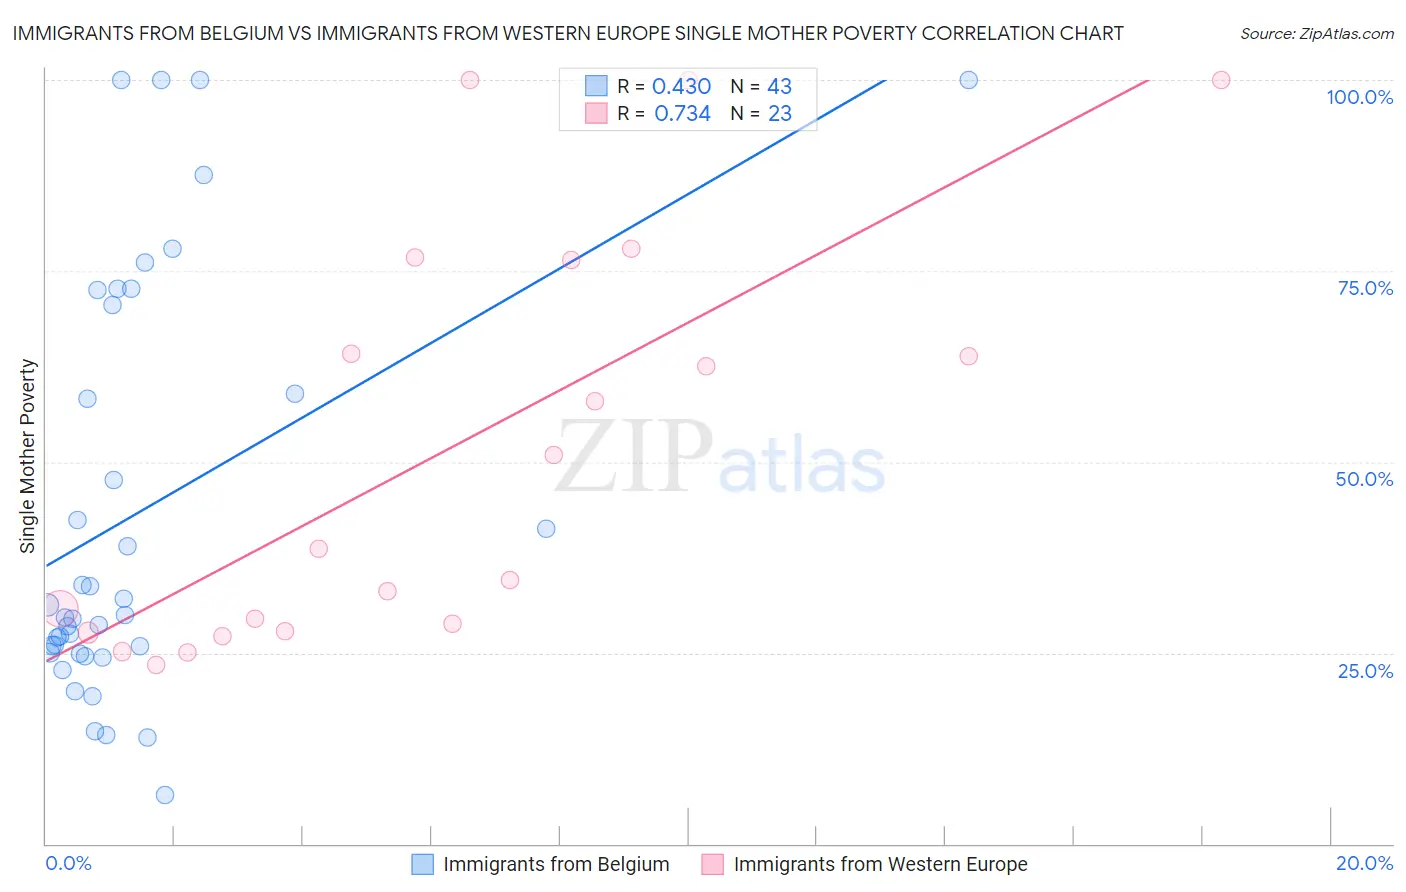
Immigrants from Belgium vs Immigrants from Western Europe Single Mother Poverty Correlation Chart
The statistical analysis conducted on geographies consisting of 144,308,237 people shows a moderate positive correlation between the proportion of Immigrants from Belgium and poverty level among single mothers in the United States with a correlation coefficient (R) of 0.430 and weighted average of 28.5%. Similarly, the statistical analysis conducted on geographies consisting of 476,604,717 people shows a strong positive correlation between the proportion of Immigrants from Western Europe and poverty level among single mothers in the United States with a correlation coefficient (R) of 0.734 and weighted average of 28.9%, a difference of 1.4%.
Single Mother Poverty Correlation Summary
| Measurement | Immigrants from Belgium | Immigrants from Western Europe |
| Minimum | 6.3% | 23.4% |
| Maximum | 100.0% | 100.0% |
| Range | 93.7% | 76.6% |
| Mean | 43.3% | 51.4% |
| Median | 30.0% | 38.6% |
| Interquartile 25% (IQ1) | 25.0% | 27.9% |
| Interquartile 75% (IQ3) | 70.5% | 76.4% |
| Interquartile Range (IQR) | 45.5% | 48.5% |
| Standard Deviation (Sample) | 27.1% | 26.6% |
| Standard Deviation (Population) | 26.8% | 26.1% |
Demographics Similar to Immigrants from Belgium and Immigrants from Western Europe by Single Mother Poverty
In terms of single mother poverty, the demographic groups most similar to Immigrants from Belgium are Immigrants from Canada (28.4%, a difference of 0.050%), Samoan (28.5%, a difference of 0.050%), Immigrants from Colombia (28.5%, a difference of 0.060%), Danish (28.5%, a difference of 0.16%), and South African (28.5%, a difference of 0.21%). Similarly, the demographic groups most similar to Immigrants from Western Europe are Iraqi (28.8%, a difference of 0.030%), Ugandan (28.8%, a difference of 0.040%), Portuguese (28.8%, a difference of 0.13%), Slovene (28.8%, a difference of 0.33%), and Austrian (28.7%, a difference of 0.51%).
| Demographics | Rating | Rank | Single Mother Poverty |
| Immigrants | Canada | 88.9 /100 | #137 | Excellent 28.4% |
| Immigrants | Belgium | 88.5 /100 | #138 | Excellent 28.5% |
| Samoans | 88.1 /100 | #139 | Excellent 28.5% |
| Immigrants | Colombia | 88.0 /100 | #140 | Excellent 28.5% |
| Danes | 87.1 /100 | #141 | Excellent 28.5% |
| South Africans | 86.6 /100 | #142 | Excellent 28.5% |
| Immigrants | North America | 86.5 /100 | #143 | Excellent 28.5% |
| Luxembourgers | 86.4 /100 | #144 | Excellent 28.5% |
| Immigrants | South America | 86.1 /100 | #145 | Excellent 28.5% |
| Immigrants | Denmark | 86.1 /100 | #146 | Excellent 28.5% |
| Immigrants | Lebanon | 85.3 /100 | #147 | Excellent 28.6% |
| Syrians | 85.3 /100 | #148 | Excellent 28.6% |
| Serbians | 85.0 /100 | #149 | Excellent 28.6% |
| Northern Europeans | 81.7 /100 | #150 | Excellent 28.6% |
| Immigrants | Oceania | 79.9 /100 | #151 | Good 28.7% |
| Austrians | 79.0 /100 | #152 | Good 28.7% |
| Slovenes | 76.4 /100 | #153 | Good 28.8% |
| Portuguese | 73.2 /100 | #154 | Good 28.8% |
| Ugandans | 71.7 /100 | #155 | Good 28.8% |
| Iraqis | 71.5 /100 | #156 | Good 28.8% |
| Immigrants | Western Europe | 71.1 /100 | #157 | Good 28.9% |