Immigrants from Belgium vs Immigrants from Singapore Median Household Income
COMPARE
Immigrants from Belgium
Immigrants from Singapore
Median Household Income
Median Household Income Comparison
Immigrants from Belgium
Immigrants from Singapore
$100,306
MEDIAN HOUSEHOLD INCOME
100.0/ 100
METRIC RATING
26th/ 347
METRIC RANK
$110,428
MEDIAN HOUSEHOLD INCOME
100.0/ 100
METRIC RATING
6th/ 347
METRIC RANK
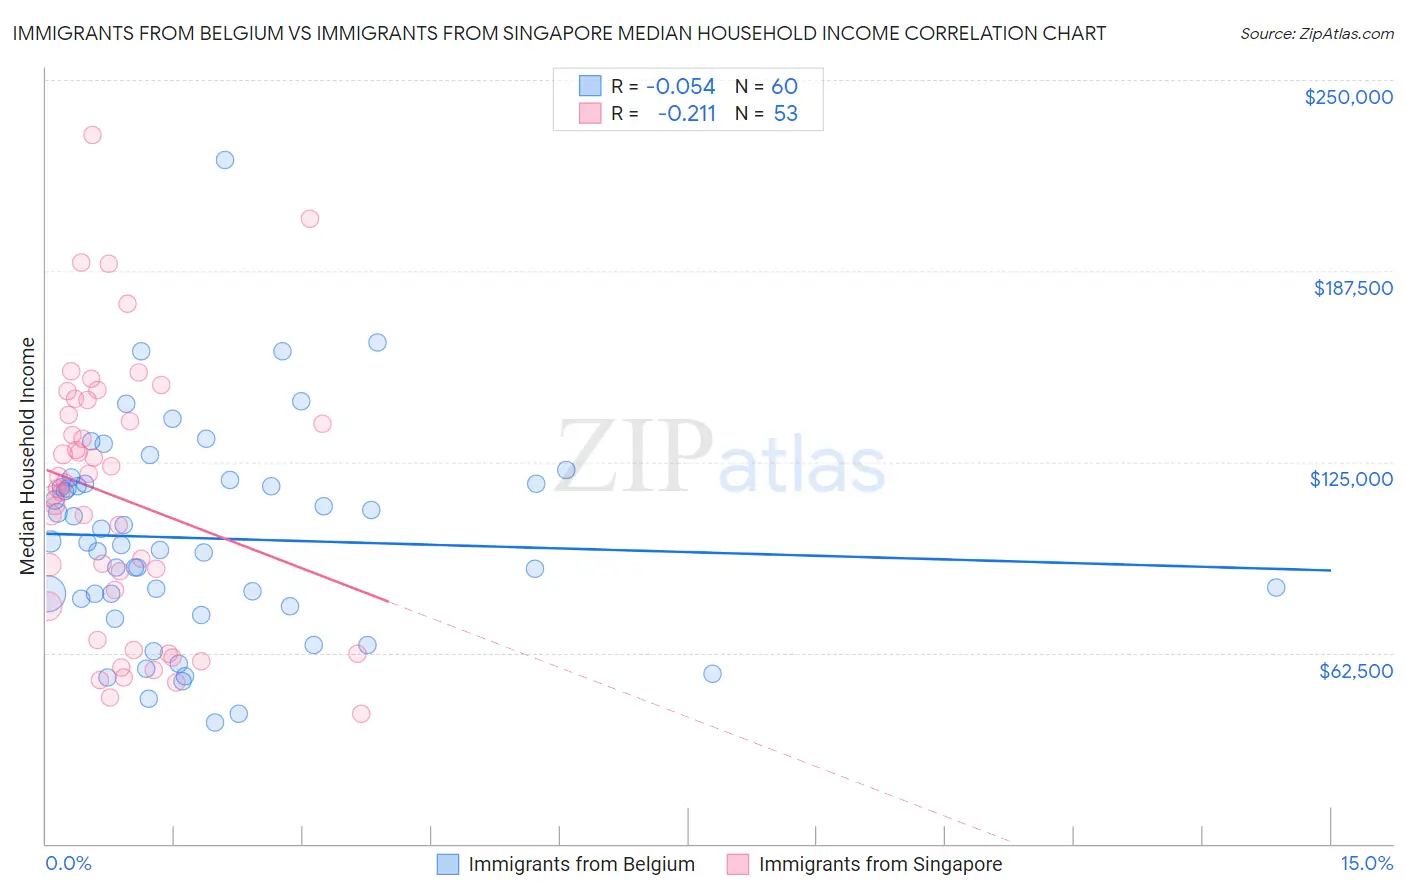
Immigrants from Belgium vs Immigrants from Singapore Median Household Income Correlation Chart
The statistical analysis conducted on geographies consisting of 146,650,493 people shows a slight negative correlation between the proportion of Immigrants from Belgium and median household income in the United States with a correlation coefficient (R) of -0.054 and weighted average of $100,306. Similarly, the statistical analysis conducted on geographies consisting of 137,415,639 people shows a weak negative correlation between the proportion of Immigrants from Singapore and median household income in the United States with a correlation coefficient (R) of -0.211 and weighted average of $110,428, a difference of 10.1%.
Median Household Income Correlation Summary
| Measurement | Immigrants from Belgium | Immigrants from Singapore |
| Minimum | $39,542 | $42,500 |
| Maximum | $223,750 | $232,046 |
| Range | $184,208 | $189,546 |
| Mean | $99,959 | $113,253 |
| Median | $98,272 | $116,276 |
| Interquartile 25% (IQ1) | $78,898 | $72,208 |
| Interquartile 75% (IQ3) | $117,778 | $142,877 |
| Interquartile Range (IQR) | $38,881 | $70,669 |
| Standard Deviation (Sample) | $34,343 | $43,740 |
| Standard Deviation (Population) | $34,056 | $43,325 |
Demographics Similar to Immigrants from Belgium and Immigrants from Singapore by Median Household Income
In terms of median household income, the demographic groups most similar to Immigrants from Belgium are Immigrants from Sweden ($100,699, a difference of 0.39%), Immigrants from Japan ($100,711, a difference of 0.40%), Immigrants from Bolivia ($101,394, a difference of 1.1%), Asian ($101,681, a difference of 1.4%), and Eastern European ($101,781, a difference of 1.5%). Similarly, the demographic groups most similar to Immigrants from Singapore are Iranian ($109,835, a difference of 0.54%), Immigrants from Iran ($108,055, a difference of 2.2%), Okinawan ($106,624, a difference of 3.6%), Immigrants from South Central Asia ($106,057, a difference of 4.1%), and Immigrants from China ($105,335, a difference of 4.8%).
| Demographics | Rating | Rank | Median Household Income |
| Immigrants | Singapore | 100.0 /100 | #6 | Exceptional $110,428 |
| Iranians | 100.0 /100 | #7 | Exceptional $109,835 |
| Immigrants | Iran | 100.0 /100 | #8 | Exceptional $108,055 |
| Okinawans | 100.0 /100 | #9 | Exceptional $106,624 |
| Immigrants | South Central Asia | 100.0 /100 | #10 | Exceptional $106,057 |
| Immigrants | China | 100.0 /100 | #11 | Exceptional $105,335 |
| Indians (Asian) | 100.0 /100 | #12 | Exceptional $105,262 |
| Immigrants | Eastern Asia | 100.0 /100 | #13 | Exceptional $104,796 |
| Immigrants | Ireland | 100.0 /100 | #14 | Exceptional $104,692 |
| Immigrants | Israel | 100.0 /100 | #15 | Exceptional $104,090 |
| Burmese | 100.0 /100 | #16 | Exceptional $103,145 |
| Immigrants | Korea | 100.0 /100 | #17 | Exceptional $102,962 |
| Cypriots | 100.0 /100 | #18 | Exceptional $102,843 |
| Immigrants | Australia | 100.0 /100 | #19 | Exceptional $102,562 |
| Bolivians | 100.0 /100 | #20 | Exceptional $102,195 |
| Eastern Europeans | 100.0 /100 | #21 | Exceptional $101,781 |
| Asians | 100.0 /100 | #22 | Exceptional $101,681 |
| Immigrants | Bolivia | 100.0 /100 | #23 | Exceptional $101,394 |
| Immigrants | Japan | 100.0 /100 | #24 | Exceptional $100,711 |
| Immigrants | Sweden | 100.0 /100 | #25 | Exceptional $100,699 |
| Immigrants | Belgium | 100.0 /100 | #26 | Exceptional $100,306 |