Immigrants from Belgium vs Dutch West Indian Single Mother Poverty
COMPARE
Immigrants from Belgium
Dutch West Indian
Single Mother Poverty
Single Mother Poverty Comparison
Immigrants from Belgium
Dutch West Indians
28.5%
SINGLE MOTHER POVERTY
88.5/ 100
METRIC RATING
138th/ 347
METRIC RANK
36.8%
SINGLE MOTHER POVERTY
0.0/ 100
METRIC RATING
332nd/ 347
METRIC RANK
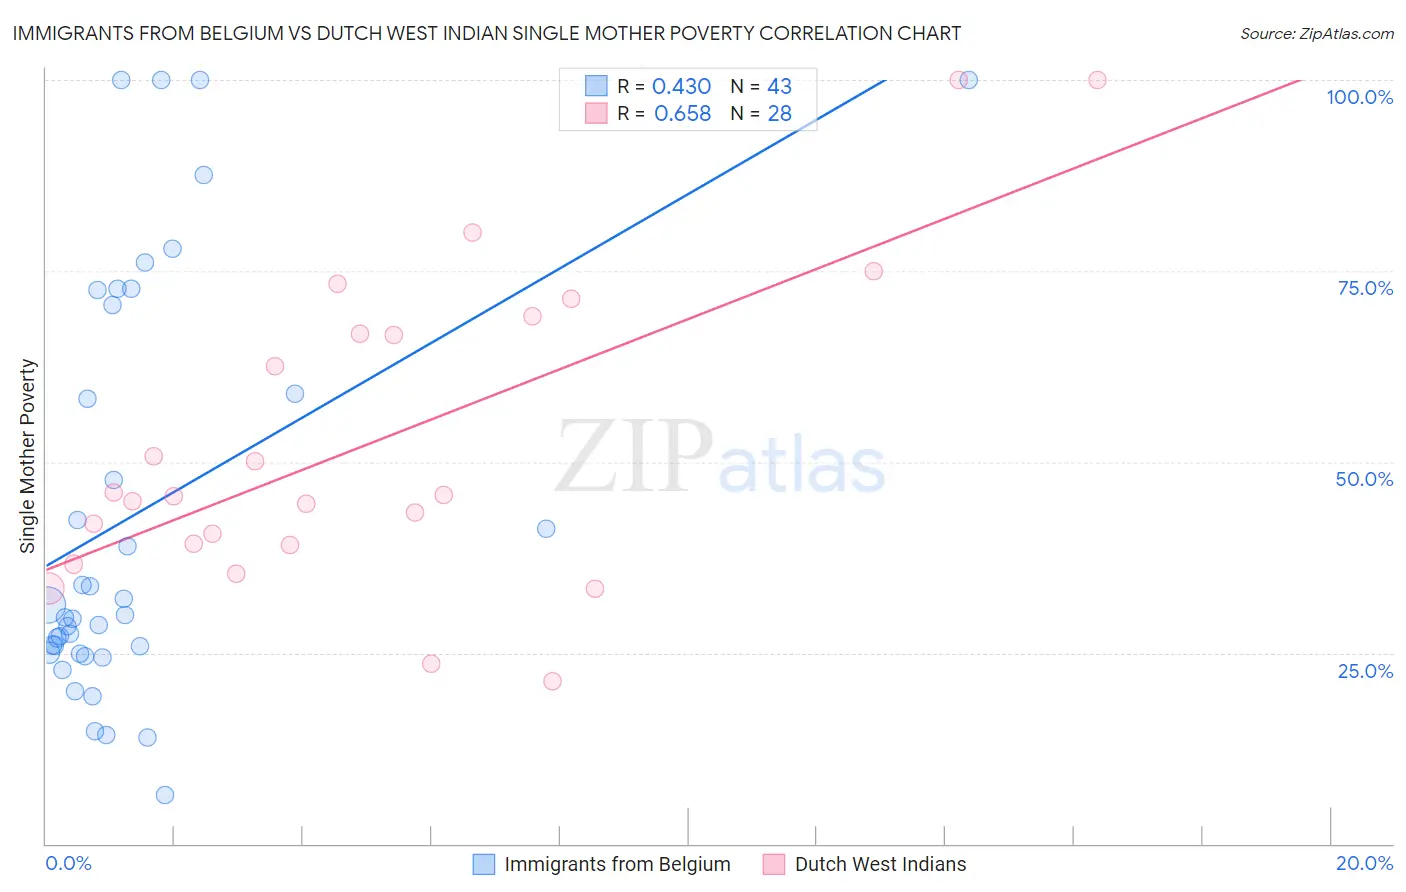
Immigrants from Belgium vs Dutch West Indian Single Mother Poverty Correlation Chart
The statistical analysis conducted on geographies consisting of 144,308,237 people shows a moderate positive correlation between the proportion of Immigrants from Belgium and poverty level among single mothers in the United States with a correlation coefficient (R) of 0.430 and weighted average of 28.5%. Similarly, the statistical analysis conducted on geographies consisting of 85,385,586 people shows a significant positive correlation between the proportion of Dutch West Indians and poverty level among single mothers in the United States with a correlation coefficient (R) of 0.658 and weighted average of 36.8%, a difference of 29.2%.
Single Mother Poverty Correlation Summary
| Measurement | Immigrants from Belgium | Dutch West Indian |
| Minimum | 6.3% | 21.3% |
| Maximum | 100.0% | 100.0% |
| Range | 93.7% | 78.7% |
| Mean | 43.3% | 52.8% |
| Median | 30.0% | 45.6% |
| Interquartile 25% (IQ1) | 25.0% | 39.2% |
| Interquartile 75% (IQ3) | 70.5% | 67.9% |
| Interquartile Range (IQR) | 45.5% | 28.7% |
| Standard Deviation (Sample) | 27.1% | 20.5% |
| Standard Deviation (Population) | 26.8% | 20.2% |
Similar Demographics by Single Mother Poverty
Demographics Similar to Immigrants from Belgium by Single Mother Poverty
In terms of single mother poverty, the demographic groups most similar to Immigrants from Belgium are Native Hawaiian (28.4%, a difference of 0.050%), Immigrants from Canada (28.4%, a difference of 0.050%), Samoan (28.5%, a difference of 0.050%), Immigrants from Colombia (28.5%, a difference of 0.060%), and Immigrants from Southern Europe (28.4%, a difference of 0.090%).
| Demographics | Rating | Rank | Single Mother Poverty |
| Immigrants | Austria | 90.3 /100 | #131 | Exceptional 28.4% |
| Immigrants | Morocco | 89.5 /100 | #132 | Excellent 28.4% |
| Swedes | 89.4 /100 | #133 | Excellent 28.4% |
| Immigrants | Southern Europe | 89.2 /100 | #134 | Excellent 28.4% |
| Immigrants | Spain | 89.2 /100 | #135 | Excellent 28.4% |
| Native Hawaiians | 88.9 /100 | #136 | Excellent 28.4% |
| Immigrants | Canada | 88.9 /100 | #137 | Excellent 28.4% |
| Immigrants | Belgium | 88.5 /100 | #138 | Excellent 28.5% |
| Samoans | 88.1 /100 | #139 | Excellent 28.5% |
| Immigrants | Colombia | 88.0 /100 | #140 | Excellent 28.5% |
| Danes | 87.1 /100 | #141 | Excellent 28.5% |
| South Africans | 86.6 /100 | #142 | Excellent 28.5% |
| Immigrants | North America | 86.5 /100 | #143 | Excellent 28.5% |
| Luxembourgers | 86.4 /100 | #144 | Excellent 28.5% |
| Immigrants | South America | 86.1 /100 | #145 | Excellent 28.5% |
Demographics Similar to Dutch West Indians by Single Mother Poverty
In terms of single mother poverty, the demographic groups most similar to Dutch West Indians are Creek (36.7%, a difference of 0.24%), Native/Alaskan (36.6%, a difference of 0.40%), Apache (36.6%, a difference of 0.50%), Menominee (37.1%, a difference of 0.78%), and Choctaw (36.4%, a difference of 0.98%).
| Demographics | Rating | Rank | Single Mother Poverty |
| Ute | 0.0 /100 | #325 | Tragic 35.7% |
| Seminole | 0.0 /100 | #326 | Tragic 35.8% |
| Yakama | 0.0 /100 | #327 | Tragic 36.4% |
| Choctaw | 0.0 /100 | #328 | Tragic 36.4% |
| Apache | 0.0 /100 | #329 | Tragic 36.6% |
| Natives/Alaskans | 0.0 /100 | #330 | Tragic 36.6% |
| Creek | 0.0 /100 | #331 | Tragic 36.7% |
| Dutch West Indians | 0.0 /100 | #332 | Tragic 36.8% |
| Menominee | 0.0 /100 | #333 | Tragic 37.1% |
| Pueblo | 0.0 /100 | #334 | Tragic 37.2% |
| Yuman | 0.0 /100 | #335 | Tragic 37.8% |
| Cheyenne | 0.0 /100 | #336 | Tragic 38.5% |
| Immigrants | Yemen | 0.0 /100 | #337 | Tragic 38.5% |
| Pima | 0.0 /100 | #338 | Tragic 38.6% |
| Crow | 0.0 /100 | #339 | Tragic 38.6% |