Immigrants from Belgium vs Immigrants from Jamaica Single Mother Poverty
COMPARE
Immigrants from Belgium
Immigrants from Jamaica
Single Mother Poverty
Single Mother Poverty Comparison
Immigrants from Belgium
Immigrants from Jamaica
28.5%
SINGLE MOTHER POVERTY
88.5/ 100
METRIC RATING
138th/ 347
METRIC RANK
29.6%
SINGLE MOTHER POVERTY
22.0/ 100
METRIC RATING
197th/ 347
METRIC RANK
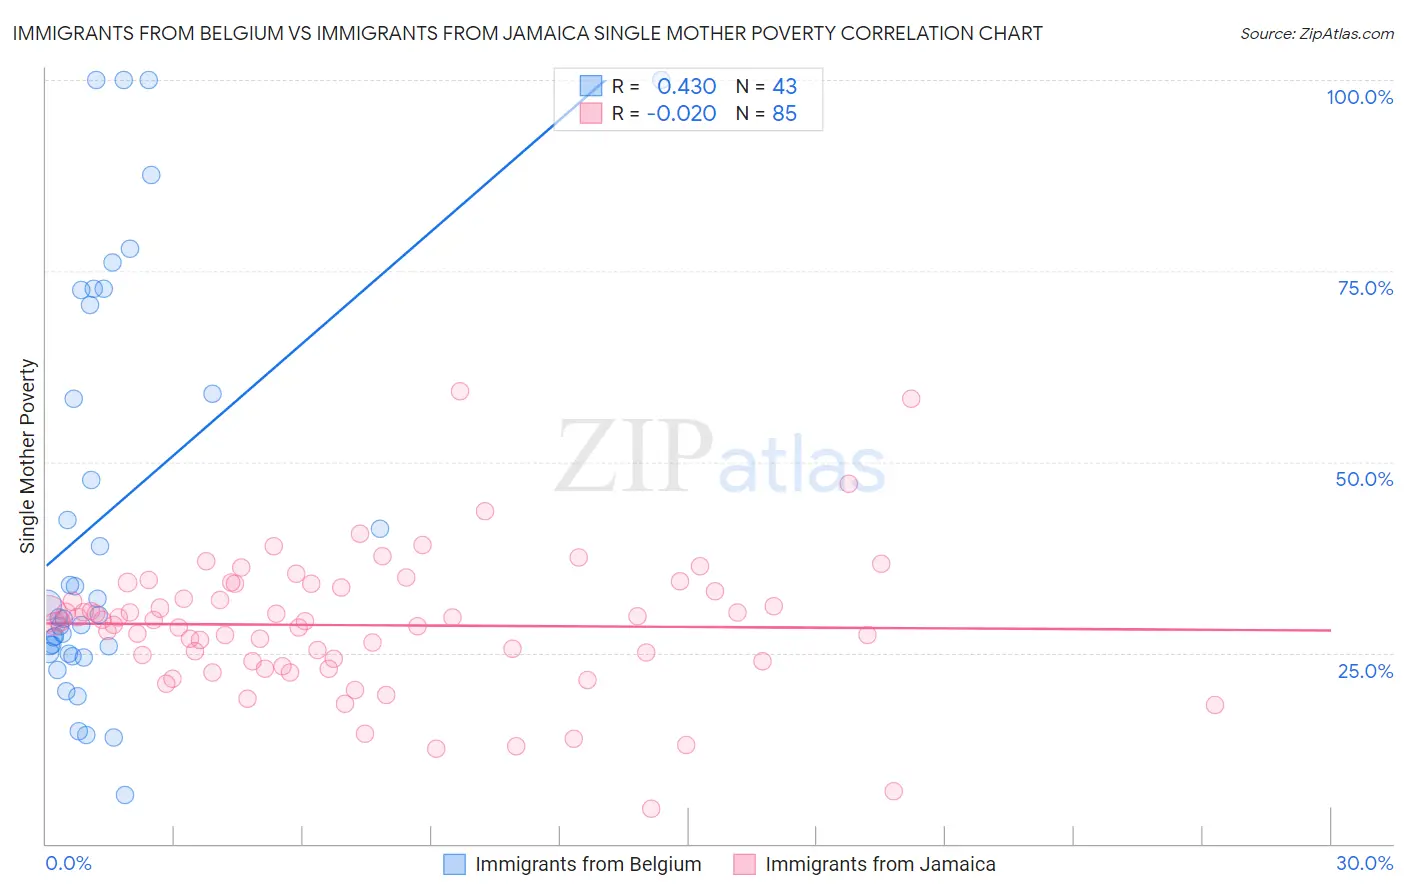
Immigrants from Belgium vs Immigrants from Jamaica Single Mother Poverty Correlation Chart
The statistical analysis conducted on geographies consisting of 144,308,237 people shows a moderate positive correlation between the proportion of Immigrants from Belgium and poverty level among single mothers in the United States with a correlation coefficient (R) of 0.430 and weighted average of 28.5%. Similarly, the statistical analysis conducted on geographies consisting of 296,527,600 people shows no correlation between the proportion of Immigrants from Jamaica and poverty level among single mothers in the United States with a correlation coefficient (R) of -0.020 and weighted average of 29.6%, a difference of 4.1%.
Single Mother Poverty Correlation Summary
| Measurement | Immigrants from Belgium | Immigrants from Jamaica |
| Minimum | 6.3% | 4.6% |
| Maximum | 100.0% | 59.3% |
| Range | 93.7% | 54.7% |
| Mean | 43.3% | 28.6% |
| Median | 30.0% | 29.2% |
| Interquartile 25% (IQ1) | 25.0% | 23.9% |
| Interquartile 75% (IQ3) | 70.5% | 33.8% |
| Interquartile Range (IQR) | 45.5% | 9.9% |
| Standard Deviation (Sample) | 27.1% | 8.9% |
| Standard Deviation (Population) | 26.8% | 8.9% |
Similar Demographics by Single Mother Poverty
Demographics Similar to Immigrants from Belgium by Single Mother Poverty
In terms of single mother poverty, the demographic groups most similar to Immigrants from Belgium are Native Hawaiian (28.4%, a difference of 0.050%), Immigrants from Canada (28.4%, a difference of 0.050%), Samoan (28.5%, a difference of 0.050%), Immigrants from Colombia (28.5%, a difference of 0.060%), and Immigrants from Southern Europe (28.4%, a difference of 0.090%).
| Demographics | Rating | Rank | Single Mother Poverty |
| Immigrants | Austria | 90.3 /100 | #131 | Exceptional 28.4% |
| Immigrants | Morocco | 89.5 /100 | #132 | Excellent 28.4% |
| Swedes | 89.4 /100 | #133 | Excellent 28.4% |
| Immigrants | Southern Europe | 89.2 /100 | #134 | Excellent 28.4% |
| Immigrants | Spain | 89.2 /100 | #135 | Excellent 28.4% |
| Native Hawaiians | 88.9 /100 | #136 | Excellent 28.4% |
| Immigrants | Canada | 88.9 /100 | #137 | Excellent 28.4% |
| Immigrants | Belgium | 88.5 /100 | #138 | Excellent 28.5% |
| Samoans | 88.1 /100 | #139 | Excellent 28.5% |
| Immigrants | Colombia | 88.0 /100 | #140 | Excellent 28.5% |
| Danes | 87.1 /100 | #141 | Excellent 28.5% |
| South Africans | 86.6 /100 | #142 | Excellent 28.5% |
| Immigrants | North America | 86.5 /100 | #143 | Excellent 28.5% |
| Luxembourgers | 86.4 /100 | #144 | Excellent 28.5% |
| Immigrants | South America | 86.1 /100 | #145 | Excellent 28.5% |
Demographics Similar to Immigrants from Jamaica by Single Mother Poverty
In terms of single mother poverty, the demographic groups most similar to Immigrants from Jamaica are Trinidadian and Tobagonian (29.6%, a difference of 0.020%), Cuban (29.6%, a difference of 0.080%), Spanish American Indian (29.6%, a difference of 0.10%), Panamanian (29.6%, a difference of 0.14%), and Slavic (29.6%, a difference of 0.17%).
| Demographics | Rating | Rank | Single Mother Poverty |
| Immigrants | Germany | 30.4 /100 | #190 | Fair 29.5% |
| Immigrants | Trinidad and Tobago | 29.2 /100 | #191 | Fair 29.5% |
| Moroccans | 28.6 /100 | #192 | Fair 29.5% |
| Basques | 28.3 /100 | #193 | Fair 29.5% |
| Icelanders | 26.1 /100 | #194 | Fair 29.5% |
| Slavs | 24.5 /100 | #195 | Fair 29.6% |
| Spanish American Indians | 23.4 /100 | #196 | Fair 29.6% |
| Immigrants | Jamaica | 22.0 /100 | #197 | Fair 29.6% |
| Trinidadians and Tobagonians | 21.7 /100 | #198 | Fair 29.6% |
| Cubans | 20.8 /100 | #199 | Fair 29.6% |
| Panamanians | 20.0 /100 | #200 | Fair 29.6% |
| Belgians | 18.8 /100 | #201 | Poor 29.7% |
| Malaysians | 17.4 /100 | #202 | Poor 29.7% |
| Swiss | 17.2 /100 | #203 | Poor 29.7% |
| Immigrants | Immigrants | 16.6 /100 | #204 | Poor 29.7% |