Immigrants from Belarus vs Immigrants from Caribbean 10th Grade
COMPARE
Immigrants from Belarus
Immigrants from Caribbean
10th Grade
10th Grade Comparison
Immigrants from Belarus
Immigrants from Caribbean
94.4%
10TH GRADE
95.2/ 100
METRIC RATING
121st/ 347
METRIC RANK
90.6%
10TH GRADE
0.0/ 100
METRIC RATING
315th/ 347
METRIC RANK
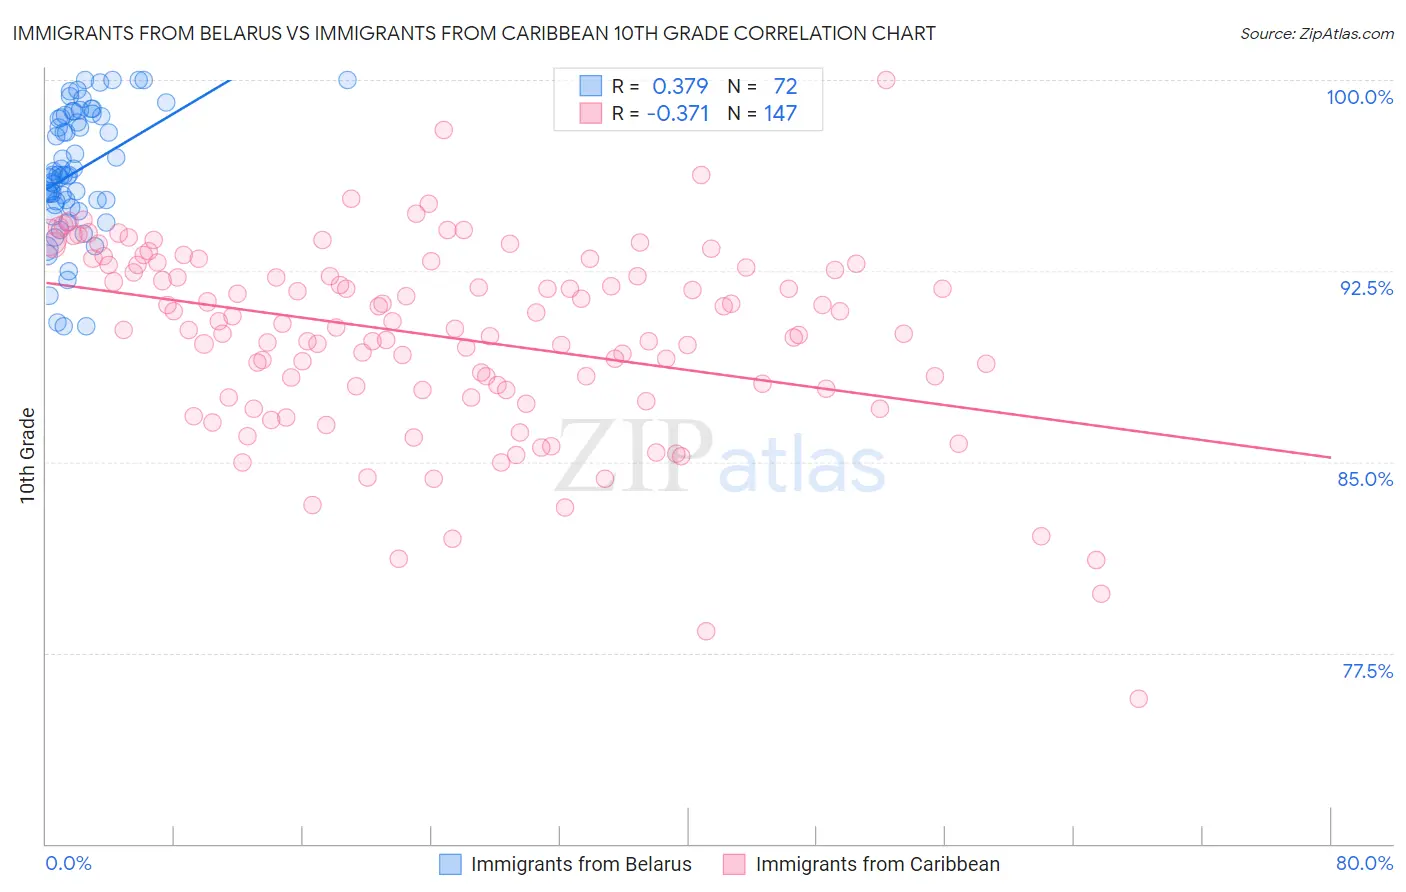
Immigrants from Belarus vs Immigrants from Caribbean 10th Grade Correlation Chart
The statistical analysis conducted on geographies consisting of 149,993,317 people shows a mild positive correlation between the proportion of Immigrants from Belarus and percentage of population with at least 10th grade education in the United States with a correlation coefficient (R) of 0.379 and weighted average of 94.4%. Similarly, the statistical analysis conducted on geographies consisting of 450,064,654 people shows a mild negative correlation between the proportion of Immigrants from Caribbean and percentage of population with at least 10th grade education in the United States with a correlation coefficient (R) of -0.371 and weighted average of 90.6%, a difference of 4.1%.
10th Grade Correlation Summary
| Measurement | Immigrants from Belarus | Immigrants from Caribbean |
| Minimum | 90.3% | 75.7% |
| Maximum | 100.0% | 100.0% |
| Range | 9.7% | 24.3% |
| Mean | 96.4% | 89.9% |
| Median | 96.3% | 90.3% |
| Interquartile 25% (IQ1) | 95.2% | 87.8% |
| Interquartile 75% (IQ3) | 98.6% | 92.7% |
| Interquartile Range (IQR) | 3.4% | 4.9% |
| Standard Deviation (Sample) | 2.5% | 3.8% |
| Standard Deviation (Population) | 2.5% | 3.8% |
Similar Demographics by 10th Grade
Demographics Similar to Immigrants from Belarus by 10th Grade
In terms of 10th grade, the demographic groups most similar to Immigrants from Belarus are Inupiat (94.4%, a difference of 0.0%), Cree (94.4%, a difference of 0.0%), Immigrants from Israel (94.4%, a difference of 0.010%), Immigrants from Taiwan (94.4%, a difference of 0.010%), and Basque (94.3%, a difference of 0.010%).
| Demographics | Rating | Rank | 10th Grade |
| German Russians | 96.3 /100 | #114 | Exceptional 94.4% |
| Delaware | 96.3 /100 | #115 | Exceptional 94.4% |
| Sioux | 96.2 /100 | #116 | Exceptional 94.4% |
| Immigrants | Hungary | 95.8 /100 | #117 | Exceptional 94.4% |
| Jordanians | 95.6 /100 | #118 | Exceptional 94.4% |
| Immigrants | Israel | 95.4 /100 | #119 | Exceptional 94.4% |
| Immigrants | Taiwan | 95.3 /100 | #120 | Exceptional 94.4% |
| Immigrants | Belarus | 95.2 /100 | #121 | Exceptional 94.4% |
| Inupiat | 95.1 /100 | #122 | Exceptional 94.4% |
| Cree | 95.1 /100 | #123 | Exceptional 94.4% |
| Basques | 94.9 /100 | #124 | Exceptional 94.3% |
| Americans | 94.4 /100 | #125 | Exceptional 94.3% |
| Immigrants | Iran | 94.4 /100 | #126 | Exceptional 94.3% |
| Israelis | 93.8 /100 | #127 | Exceptional 94.3% |
| Potawatomi | 93.6 /100 | #128 | Exceptional 94.3% |
Demographics Similar to Immigrants from Caribbean by 10th Grade
In terms of 10th grade, the demographic groups most similar to Immigrants from Caribbean are Ecuadorian (90.6%, a difference of 0.010%), Nepalese (90.7%, a difference of 0.080%), Cape Verdean (90.8%, a difference of 0.16%), Immigrants from Ecuador (90.4%, a difference of 0.18%), and Immigrants from Portugal (90.8%, a difference of 0.19%).
| Demographics | Rating | Rank | 10th Grade |
| Immigrants | Bangladesh | 0.0 /100 | #308 | Tragic 91.0% |
| Immigrants | Immigrants | 0.0 /100 | #309 | Tragic 91.0% |
| Vietnamese | 0.0 /100 | #310 | Tragic 90.9% |
| Immigrants | Cambodia | 0.0 /100 | #311 | Tragic 90.9% |
| Immigrants | Portugal | 0.0 /100 | #312 | Tragic 90.8% |
| Cape Verdeans | 0.0 /100 | #313 | Tragic 90.8% |
| Nepalese | 0.0 /100 | #314 | Tragic 90.7% |
| Immigrants | Caribbean | 0.0 /100 | #315 | Tragic 90.6% |
| Ecuadorians | 0.0 /100 | #316 | Tragic 90.6% |
| Immigrants | Ecuador | 0.0 /100 | #317 | Tragic 90.4% |
| Immigrants | Cuba | 0.0 /100 | #318 | Tragic 90.2% |
| Nicaraguans | 0.0 /100 | #319 | Tragic 90.2% |
| Houma | 0.0 /100 | #320 | Tragic 90.2% |
| Belizeans | 0.0 /100 | #321 | Tragic 90.2% |
| Tohono O'odham | 0.0 /100 | #322 | Tragic 90.1% |