Immigrants from Belarus vs Czechoslovakian Family Poverty
COMPARE
Immigrants from Belarus
Czechoslovakian
Family Poverty
Family Poverty Comparison
Immigrants from Belarus
Czechoslovakians
8.5%
FAMILY POVERTY
83.2/ 100
METRIC RATING
146th/ 347
METRIC RANK
8.0%
FAMILY POVERTY
96.8/ 100
METRIC RATING
92nd/ 347
METRIC RANK
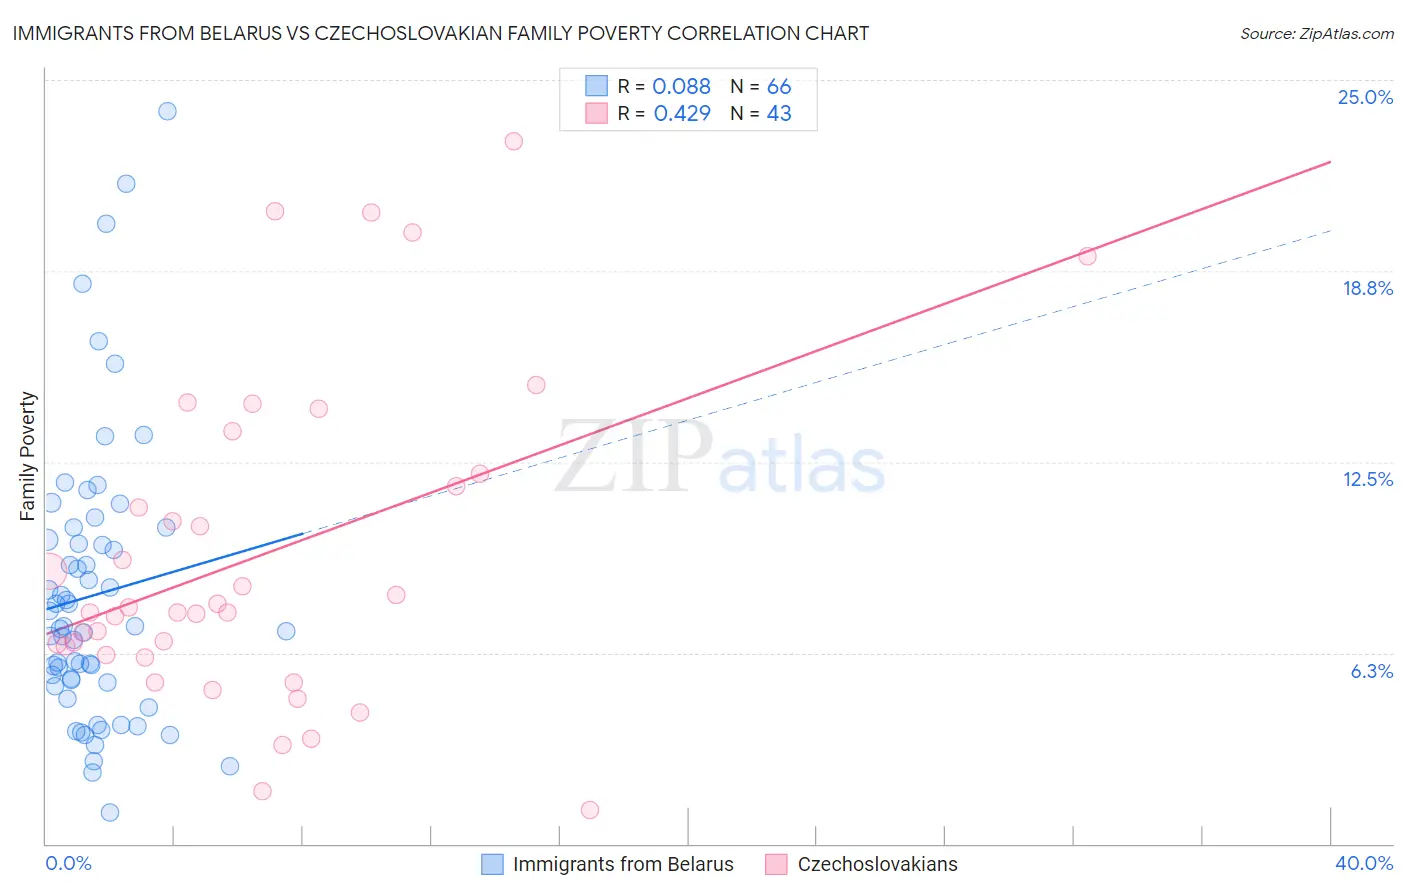
Immigrants from Belarus vs Czechoslovakian Family Poverty Correlation Chart
The statistical analysis conducted on geographies consisting of 150,053,959 people shows a slight positive correlation between the proportion of Immigrants from Belarus and poverty level among families in the United States with a correlation coefficient (R) of 0.088 and weighted average of 8.5%. Similarly, the statistical analysis conducted on geographies consisting of 367,669,162 people shows a moderate positive correlation between the proportion of Czechoslovakians and poverty level among families in the United States with a correlation coefficient (R) of 0.429 and weighted average of 8.0%, a difference of 6.7%.
Family Poverty Correlation Summary
| Measurement | Immigrants from Belarus | Czechoslovakian |
| Minimum | 1.0% | 1.1% |
| Maximum | 24.0% | 23.0% |
| Range | 22.9% | 21.9% |
| Mean | 8.1% | 9.4% |
| Median | 7.1% | 7.6% |
| Interquartile 25% (IQ1) | 5.3% | 6.2% |
| Interquartile 75% (IQ3) | 9.9% | 12.1% |
| Interquartile Range (IQR) | 4.7% | 5.9% |
| Standard Deviation (Sample) | 4.6% | 5.3% |
| Standard Deviation (Population) | 4.6% | 5.2% |
Similar Demographics by Family Poverty
Demographics Similar to Immigrants from Belarus by Family Poverty
In terms of family poverty, the demographic groups most similar to Immigrants from Belarus are Immigrants from South Eastern Asia (8.5%, a difference of 0.010%), Albanian (8.5%, a difference of 0.030%), Immigrants from Jordan (8.5%, a difference of 0.030%), Immigrants from Germany (8.5%, a difference of 0.050%), and Yugoslavian (8.5%, a difference of 0.080%).
| Demographics | Rating | Rank | Family Poverty |
| Immigrants | Nepal | 84.2 /100 | #139 | Excellent 8.5% |
| Immigrants | Kazakhstan | 84.1 /100 | #140 | Excellent 8.5% |
| Immigrants | Ukraine | 83.9 /100 | #141 | Excellent 8.5% |
| Yugoslavians | 83.5 /100 | #142 | Excellent 8.5% |
| Immigrants | Germany | 83.3 /100 | #143 | Excellent 8.5% |
| Albanians | 83.3 /100 | #144 | Excellent 8.5% |
| Immigrants | South Eastern Asia | 83.2 /100 | #145 | Excellent 8.5% |
| Immigrants | Belarus | 83.2 /100 | #146 | Excellent 8.5% |
| Immigrants | Jordan | 83.0 /100 | #147 | Excellent 8.5% |
| Scotch-Irish | 82.2 /100 | #148 | Excellent 8.6% |
| Mongolians | 80.4 /100 | #149 | Excellent 8.6% |
| Syrians | 80.3 /100 | #150 | Excellent 8.6% |
| Brazilians | 80.1 /100 | #151 | Excellent 8.6% |
| Samoans | 79.8 /100 | #152 | Good 8.6% |
| Immigrants | Spain | 79.1 /100 | #153 | Good 8.6% |
Demographics Similar to Czechoslovakians by Family Poverty
In terms of family poverty, the demographic groups most similar to Czechoslovakians are Tlingit-Haida (8.0%, a difference of 0.18%), Immigrants from Italy (8.0%, a difference of 0.24%), Immigrants from Pakistan (8.0%, a difference of 0.29%), Immigrants from Philippines (8.0%, a difference of 0.30%), and Immigrants from Turkey (8.0%, a difference of 0.32%).
| Demographics | Rating | Rank | Family Poverty |
| Immigrants | Asia | 97.4 /100 | #85 | Exceptional 7.9% |
| Scottish | 97.3 /100 | #86 | Exceptional 7.9% |
| Belgians | 97.3 /100 | #87 | Exceptional 8.0% |
| Serbians | 97.2 /100 | #88 | Exceptional 8.0% |
| Immigrants | Denmark | 97.1 /100 | #89 | Exceptional 8.0% |
| Immigrants | England | 97.1 /100 | #90 | Exceptional 8.0% |
| Immigrants | Italy | 97.0 /100 | #91 | Exceptional 8.0% |
| Czechoslovakians | 96.8 /100 | #92 | Exceptional 8.0% |
| Tlingit-Haida | 96.7 /100 | #93 | Exceptional 8.0% |
| Immigrants | Pakistan | 96.6 /100 | #94 | Exceptional 8.0% |
| Immigrants | Philippines | 96.5 /100 | #95 | Exceptional 8.0% |
| Immigrants | Turkey | 96.5 /100 | #96 | Exceptional 8.0% |
| Immigrants | Switzerland | 96.1 /100 | #97 | Exceptional 8.1% |
| Immigrants | South Africa | 95.9 /100 | #98 | Exceptional 8.1% |
| Welsh | 95.8 /100 | #99 | Exceptional 8.1% |