Immigrants from Belarus vs Czechoslovakian No Schooling Completed
COMPARE
Immigrants from Belarus
Czechoslovakian
No Schooling Completed
No Schooling Completed Comparison
Immigrants from Belarus
Czechoslovakians
2.1%
NO SCHOOLING COMPLETED
51.8/ 100
METRIC RATING
173rd/ 347
METRIC RANK
1.6%
NO SCHOOLING COMPLETED
99.9/ 100
METRIC RATING
45th/ 347
METRIC RANK
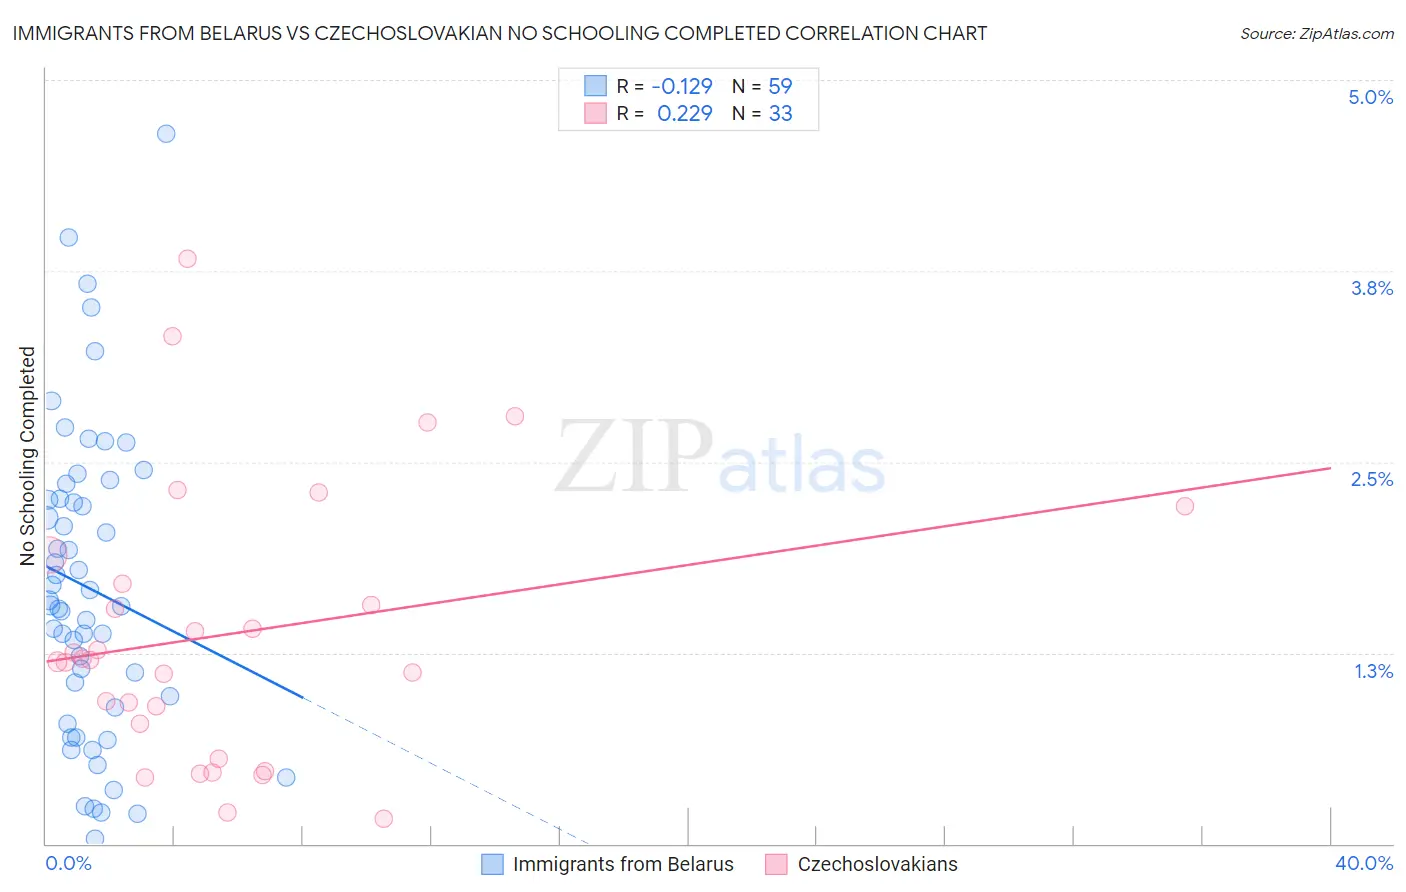
Immigrants from Belarus vs Czechoslovakian No Schooling Completed Correlation Chart
The statistical analysis conducted on geographies consisting of 149,360,708 people shows a poor negative correlation between the proportion of Immigrants from Belarus and percentage of population with no schooling in the United States with a correlation coefficient (R) of -0.129 and weighted average of 2.1%. Similarly, the statistical analysis conducted on geographies consisting of 363,588,440 people shows a weak positive correlation between the proportion of Czechoslovakians and percentage of population with no schooling in the United States with a correlation coefficient (R) of 0.229 and weighted average of 1.6%, a difference of 28.7%.
No Schooling Completed Correlation Summary
| Measurement | Immigrants from Belarus | Czechoslovakian |
| Minimum | 0.035% | 0.16% |
| Maximum | 4.6% | 3.8% |
| Range | 4.6% | 3.7% |
| Mean | 1.7% | 1.4% |
| Median | 1.6% | 1.2% |
| Interquartile 25% (IQ1) | 0.89% | 0.67% |
| Interquartile 75% (IQ3) | 2.3% | 1.8% |
| Interquartile Range (IQR) | 1.4% | 1.1% |
| Standard Deviation (Sample) | 1.00% | 0.89% |
| Standard Deviation (Population) | 0.99% | 0.88% |
Similar Demographics by No Schooling Completed
Demographics Similar to Immigrants from Belarus by No Schooling Completed
In terms of no schooling completed, the demographic groups most similar to Immigrants from Belarus are Immigrants from Argentina (2.1%, a difference of 0.13%), Immigrants from Micronesia (2.1%, a difference of 0.24%), Immigrants from Poland (2.1%, a difference of 0.46%), Argentinean (2.1%, a difference of 0.58%), and Apache (2.1%, a difference of 0.67%).
| Demographics | Rating | Rank | No Schooling Completed |
| Dutch West Indians | 59.9 /100 | #166 | Average 2.1% |
| Egyptians | 59.2 /100 | #167 | Average 2.1% |
| Cheyenne | 58.6 /100 | #168 | Average 2.1% |
| Apache | 56.7 /100 | #169 | Average 2.1% |
| Argentineans | 56.0 /100 | #170 | Average 2.1% |
| Immigrants | Poland | 55.2 /100 | #171 | Average 2.1% |
| Immigrants | Argentina | 52.7 /100 | #172 | Average 2.1% |
| Immigrants | Belarus | 51.8 /100 | #173 | Average 2.1% |
| Immigrants | Micronesia | 50.0 /100 | #174 | Average 2.1% |
| Arabs | 46.4 /100 | #175 | Average 2.1% |
| Panamanians | 45.2 /100 | #176 | Average 2.1% |
| Arapaho | 45.0 /100 | #177 | Average 2.1% |
| Pakistanis | 44.7 /100 | #178 | Average 2.1% |
| Immigrants | Kazakhstan | 44.3 /100 | #179 | Average 2.1% |
| Portuguese | 43.9 /100 | #180 | Average 2.1% |
Demographics Similar to Czechoslovakians by No Schooling Completed
In terms of no schooling completed, the demographic groups most similar to Czechoslovakians are Estonian (1.6%, a difference of 0.040%), Maltese (1.6%, a difference of 0.090%), Australian (1.6%, a difference of 0.23%), Ottawa (1.6%, a difference of 0.24%), and Bulgarian (1.6%, a difference of 0.35%).
| Demographics | Rating | Rank | No Schooling Completed |
| Northern Europeans | 99.9 /100 | #38 | Exceptional 1.6% |
| Native Hawaiians | 99.9 /100 | #39 | Exceptional 1.6% |
| Luxembourgers | 99.9 /100 | #40 | Exceptional 1.6% |
| Hungarians | 99.9 /100 | #41 | Exceptional 1.6% |
| Bulgarians | 99.9 /100 | #42 | Exceptional 1.6% |
| Australians | 99.9 /100 | #43 | Exceptional 1.6% |
| Estonians | 99.9 /100 | #44 | Exceptional 1.6% |
| Czechoslovakians | 99.9 /100 | #45 | Exceptional 1.6% |
| Maltese | 99.9 /100 | #46 | Exceptional 1.6% |
| Ottawa | 99.9 /100 | #47 | Exceptional 1.6% |
| Immigrants | Scotland | 99.9 /100 | #48 | Exceptional 1.6% |
| Whites/Caucasians | 99.9 /100 | #49 | Exceptional 1.6% |
| Celtics | 99.9 /100 | #50 | Exceptional 1.6% |
| Chippewa | 99.8 /100 | #51 | Exceptional 1.6% |
| Immigrants | Canada | 99.8 /100 | #52 | Exceptional 1.6% |