Immigrants from Ghana vs Czechoslovakian Family Poverty
COMPARE
Immigrants from Ghana
Czechoslovakian
Family Poverty
Family Poverty Comparison
Immigrants from Ghana
Czechoslovakians
10.8%
FAMILY POVERTY
0.2/ 100
METRIC RATING
257th/ 347
METRIC RANK
8.0%
FAMILY POVERTY
96.8/ 100
METRIC RATING
92nd/ 347
METRIC RANK
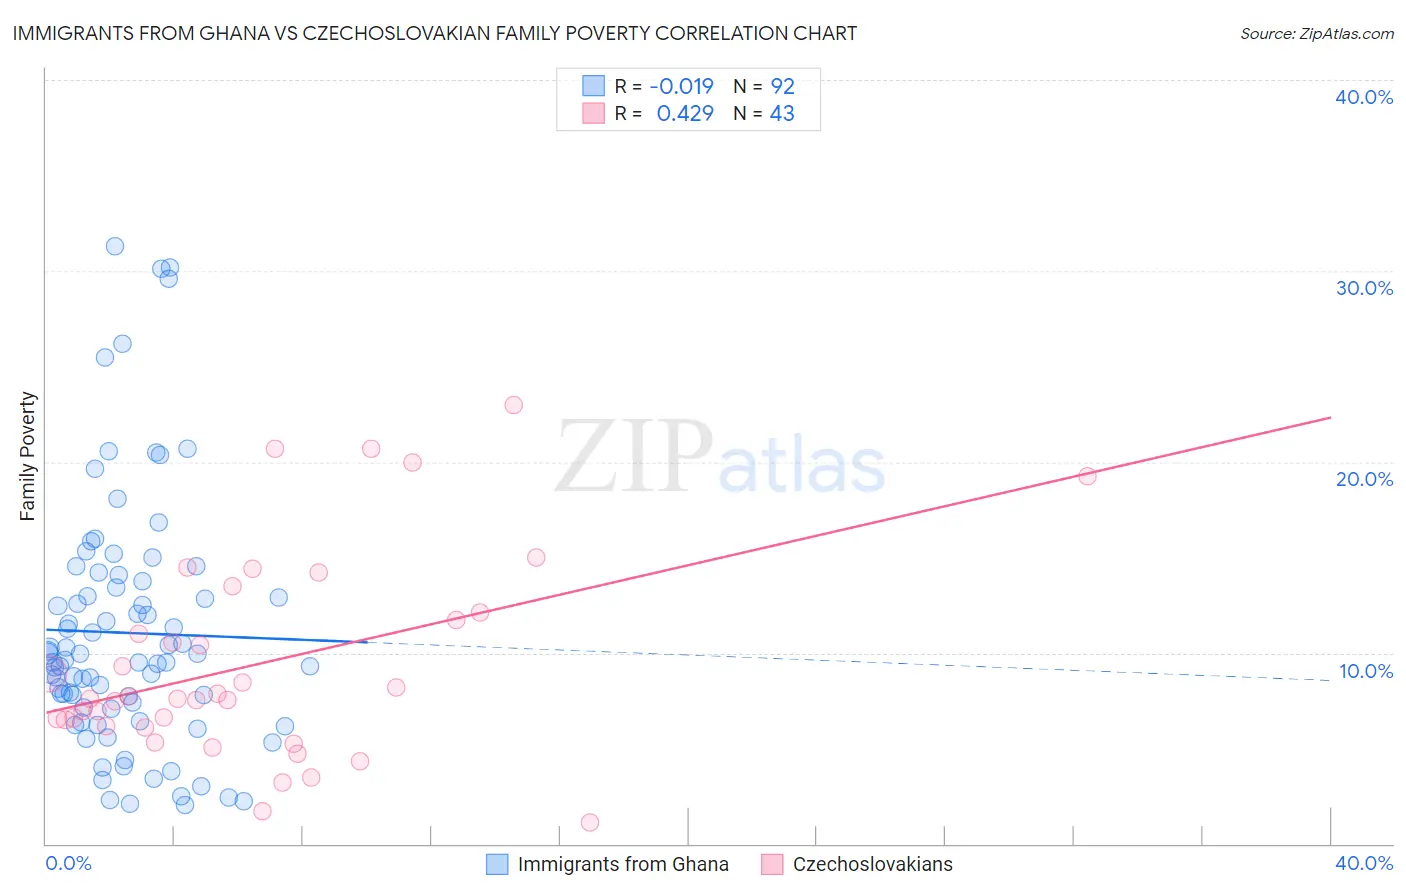
Immigrants from Ghana vs Czechoslovakian Family Poverty Correlation Chart
The statistical analysis conducted on geographies consisting of 199,614,936 people shows no correlation between the proportion of Immigrants from Ghana and poverty level among families in the United States with a correlation coefficient (R) of -0.019 and weighted average of 10.8%. Similarly, the statistical analysis conducted on geographies consisting of 367,669,162 people shows a moderate positive correlation between the proportion of Czechoslovakians and poverty level among families in the United States with a correlation coefficient (R) of 0.429 and weighted average of 8.0%, a difference of 35.6%.
Family Poverty Correlation Summary
| Measurement | Immigrants from Ghana | Czechoslovakian |
| Minimum | 2.0% | 1.1% |
| Maximum | 31.3% | 23.0% |
| Range | 29.3% | 21.9% |
| Mean | 11.0% | 9.4% |
| Median | 9.6% | 7.6% |
| Interquartile 25% (IQ1) | 7.1% | 6.2% |
| Interquartile 75% (IQ3) | 13.6% | 12.1% |
| Interquartile Range (IQR) | 6.5% | 5.9% |
| Standard Deviation (Sample) | 6.5% | 5.3% |
| Standard Deviation (Population) | 6.5% | 5.2% |
Similar Demographics by Family Poverty
Demographics Similar to Immigrants from Ghana by Family Poverty
In terms of family poverty, the demographic groups most similar to Immigrants from Ghana are Subsaharan African (10.9%, a difference of 0.030%), Chickasaw (10.8%, a difference of 0.040%), Mexican American Indian (10.9%, a difference of 0.070%), Immigrants from Liberia (10.8%, a difference of 0.30%), and Bangladeshi (10.9%, a difference of 0.42%).
| Demographics | Rating | Rank | Family Poverty |
| Salvadorans | 0.3 /100 | #250 | Tragic 10.7% |
| Iroquois | 0.3 /100 | #251 | Tragic 10.7% |
| Immigrants | Zaire | 0.3 /100 | #252 | Tragic 10.7% |
| Immigrants | Western Africa | 0.3 /100 | #253 | Tragic 10.7% |
| Ecuadorians | 0.2 /100 | #254 | Tragic 10.8% |
| Immigrants | Liberia | 0.2 /100 | #255 | Tragic 10.8% |
| Chickasaw | 0.2 /100 | #256 | Tragic 10.8% |
| Immigrants | Ghana | 0.2 /100 | #257 | Tragic 10.8% |
| Sub-Saharan Africans | 0.2 /100 | #258 | Tragic 10.9% |
| Mexican American Indians | 0.2 /100 | #259 | Tragic 10.9% |
| Bangladeshis | 0.2 /100 | #260 | Tragic 10.9% |
| Shoshone | 0.2 /100 | #261 | Tragic 10.9% |
| Spanish American Indians | 0.2 /100 | #262 | Tragic 10.9% |
| Cape Verdeans | 0.1 /100 | #263 | Tragic 10.9% |
| Trinidadians and Tobagonians | 0.1 /100 | #264 | Tragic 10.9% |
Demographics Similar to Czechoslovakians by Family Poverty
In terms of family poverty, the demographic groups most similar to Czechoslovakians are Tlingit-Haida (8.0%, a difference of 0.18%), Immigrants from Italy (8.0%, a difference of 0.24%), Immigrants from Pakistan (8.0%, a difference of 0.29%), Immigrants from Philippines (8.0%, a difference of 0.30%), and Immigrants from Turkey (8.0%, a difference of 0.32%).
| Demographics | Rating | Rank | Family Poverty |
| Immigrants | Asia | 97.4 /100 | #85 | Exceptional 7.9% |
| Scottish | 97.3 /100 | #86 | Exceptional 7.9% |
| Belgians | 97.3 /100 | #87 | Exceptional 8.0% |
| Serbians | 97.2 /100 | #88 | Exceptional 8.0% |
| Immigrants | Denmark | 97.1 /100 | #89 | Exceptional 8.0% |
| Immigrants | England | 97.1 /100 | #90 | Exceptional 8.0% |
| Immigrants | Italy | 97.0 /100 | #91 | Exceptional 8.0% |
| Czechoslovakians | 96.8 /100 | #92 | Exceptional 8.0% |
| Tlingit-Haida | 96.7 /100 | #93 | Exceptional 8.0% |
| Immigrants | Pakistan | 96.6 /100 | #94 | Exceptional 8.0% |
| Immigrants | Philippines | 96.5 /100 | #95 | Exceptional 8.0% |
| Immigrants | Turkey | 96.5 /100 | #96 | Exceptional 8.0% |
| Immigrants | Switzerland | 96.1 /100 | #97 | Exceptional 8.1% |
| Immigrants | South Africa | 95.9 /100 | #98 | Exceptional 8.1% |
| Welsh | 95.8 /100 | #99 | Exceptional 8.1% |