Immigrants from Bahamas vs Venezuelan Female Unemployment
COMPARE
Immigrants from Bahamas
Venezuelan
Female Unemployment
Female Unemployment Comparison
Immigrants from Bahamas
Venezuelans
5.8%
FEMALE UNEMPLOYMENT
0.1/ 100
METRIC RATING
264th/ 347
METRIC RANK
5.0%
FEMALE UNEMPLOYMENT
96.9/ 100
METRIC RATING
87th/ 347
METRIC RANK
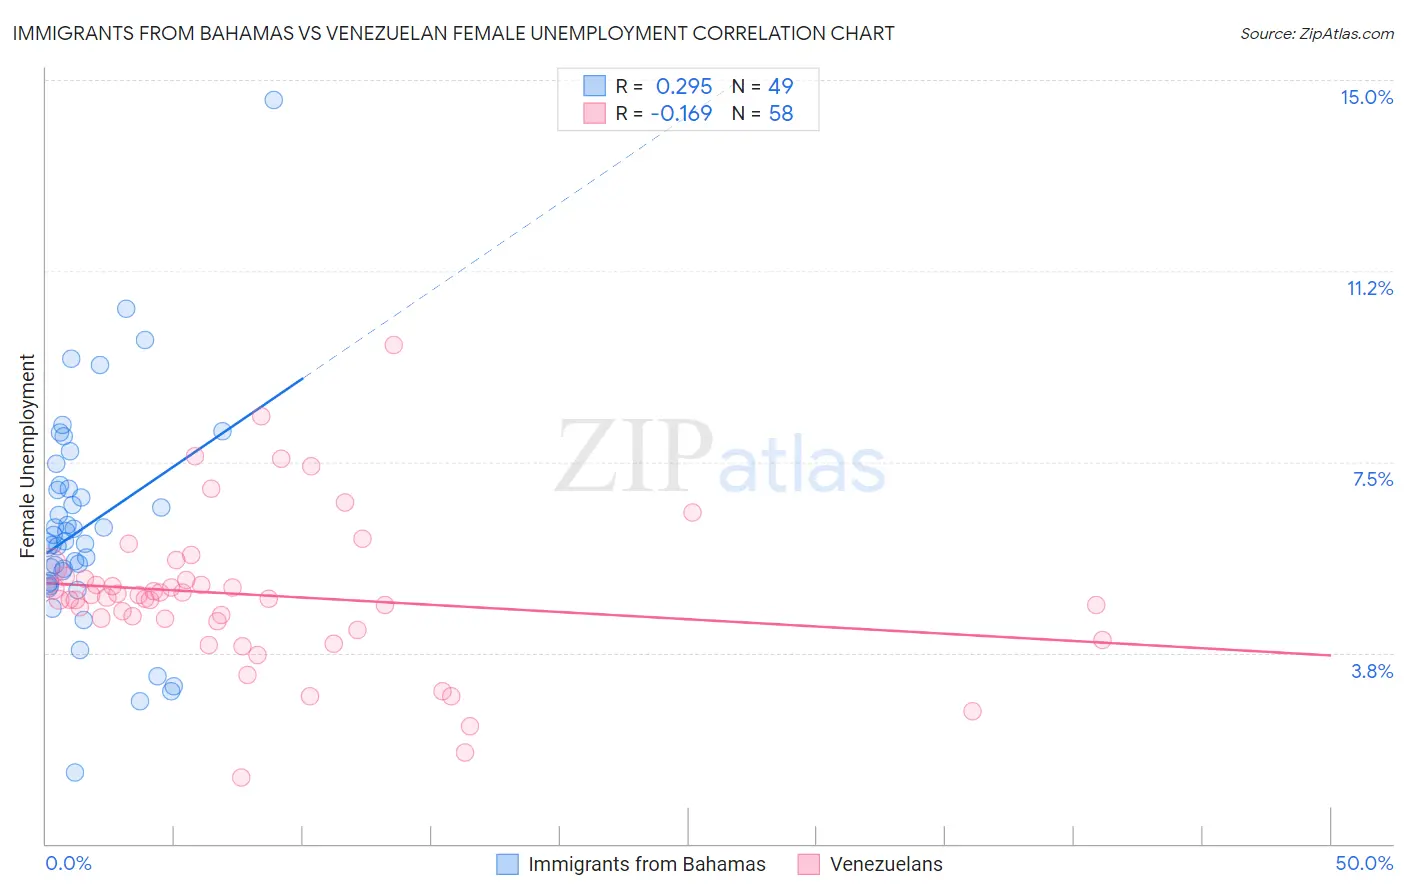
Immigrants from Bahamas vs Venezuelan Female Unemployment Correlation Chart
The statistical analysis conducted on geographies consisting of 104,550,633 people shows a weak positive correlation between the proportion of Immigrants from Bahamas and unemploymnet rate among females in the United States with a correlation coefficient (R) of 0.295 and weighted average of 5.8%. Similarly, the statistical analysis conducted on geographies consisting of 305,755,404 people shows a poor negative correlation between the proportion of Venezuelans and unemploymnet rate among females in the United States with a correlation coefficient (R) of -0.169 and weighted average of 5.0%, a difference of 17.1%.
Female Unemployment Correlation Summary
| Measurement | Immigrants from Bahamas | Venezuelan |
| Minimum | 1.4% | 1.3% |
| Maximum | 14.6% | 9.8% |
| Range | 13.2% | 8.5% |
| Mean | 6.2% | 4.9% |
| Median | 5.9% | 4.8% |
| Interquartile 25% (IQ1) | 5.1% | 4.4% |
| Interquartile 75% (IQ3) | 7.0% | 5.2% |
| Interquartile Range (IQR) | 1.9% | 0.83% |
| Standard Deviation (Sample) | 2.2% | 1.5% |
| Standard Deviation (Population) | 2.2% | 1.5% |
Similar Demographics by Female Unemployment
Demographics Similar to Immigrants from Bahamas by Female Unemployment
In terms of female unemployment, the demographic groups most similar to Immigrants from Bahamas are Immigrants from the Azores (5.8%, a difference of 0.39%), Blackfeet (5.9%, a difference of 0.40%), Cape Verdean (5.9%, a difference of 0.68%), Nepalese (5.9%, a difference of 0.79%), and Honduran (5.9%, a difference of 0.89%).
| Demographics | Rating | Rank | Female Unemployment |
| Dutch West Indians | 0.3 /100 | #257 | Tragic 5.7% |
| Immigrants | Portugal | 0.2 /100 | #258 | Tragic 5.8% |
| Immigrants | Fiji | 0.2 /100 | #259 | Tragic 5.8% |
| Nigerians | 0.2 /100 | #260 | Tragic 5.8% |
| Kiowa | 0.1 /100 | #261 | Tragic 5.8% |
| Immigrants | Nigeria | 0.1 /100 | #262 | Tragic 5.8% |
| Immigrants | Azores | 0.1 /100 | #263 | Tragic 5.8% |
| Immigrants | Bahamas | 0.1 /100 | #264 | Tragic 5.8% |
| Blackfeet | 0.0 /100 | #265 | Tragic 5.9% |
| Cape Verdeans | 0.0 /100 | #266 | Tragic 5.9% |
| Nepalese | 0.0 /100 | #267 | Tragic 5.9% |
| Hondurans | 0.0 /100 | #268 | Tragic 5.9% |
| Immigrants | Western Africa | 0.0 /100 | #269 | Tragic 5.9% |
| Immigrants | Honduras | 0.0 /100 | #270 | Tragic 5.9% |
| Central Americans | 0.0 /100 | #271 | Tragic 5.9% |
Demographics Similar to Venezuelans by Female Unemployment
In terms of female unemployment, the demographic groups most similar to Venezuelans are Bolivian (5.0%, a difference of 0.090%), Immigrants from Sudan (5.0%, a difference of 0.090%), Ukrainian (5.0%, a difference of 0.10%), Canadian (5.0%, a difference of 0.14%), and Immigrants from Taiwan (5.0%, a difference of 0.15%).
| Demographics | Rating | Rank | Female Unemployment |
| New Zealanders | 97.4 /100 | #80 | Exceptional 5.0% |
| Filipinos | 97.3 /100 | #81 | Exceptional 5.0% |
| Immigrants | Australia | 97.3 /100 | #82 | Exceptional 5.0% |
| Immigrants | Serbia | 97.2 /100 | #83 | Exceptional 5.0% |
| Canadians | 97.2 /100 | #84 | Exceptional 5.0% |
| Ukrainians | 97.1 /100 | #85 | Exceptional 5.0% |
| Bolivians | 97.1 /100 | #86 | Exceptional 5.0% |
| Venezuelans | 96.9 /100 | #87 | Exceptional 5.0% |
| Immigrants | Sudan | 96.7 /100 | #88 | Exceptional 5.0% |
| Immigrants | Taiwan | 96.6 /100 | #89 | Exceptional 5.0% |
| Immigrants | Sweden | 96.3 /100 | #90 | Exceptional 5.0% |
| Immigrants | Japan | 96.0 /100 | #91 | Exceptional 5.0% |
| Romanians | 95.9 /100 | #92 | Exceptional 5.0% |
| Immigrants | Austria | 95.7 /100 | #93 | Exceptional 5.0% |
| Immigrants | Malaysia | 95.7 /100 | #94 | Exceptional 5.0% |