Immigrants from Australia vs U.S. Virgin Islander Female Poverty
COMPARE
Immigrants from Australia
U.S. Virgin Islander
Female Poverty
Female Poverty Comparison
Immigrants from Australia
U.S. Virgin Islanders
12.2%
FEMALE POVERTY
98.1/ 100
METRIC RATING
60th/ 347
METRIC RANK
17.3%
FEMALE POVERTY
0.0/ 100
METRIC RATING
315th/ 347
METRIC RANK
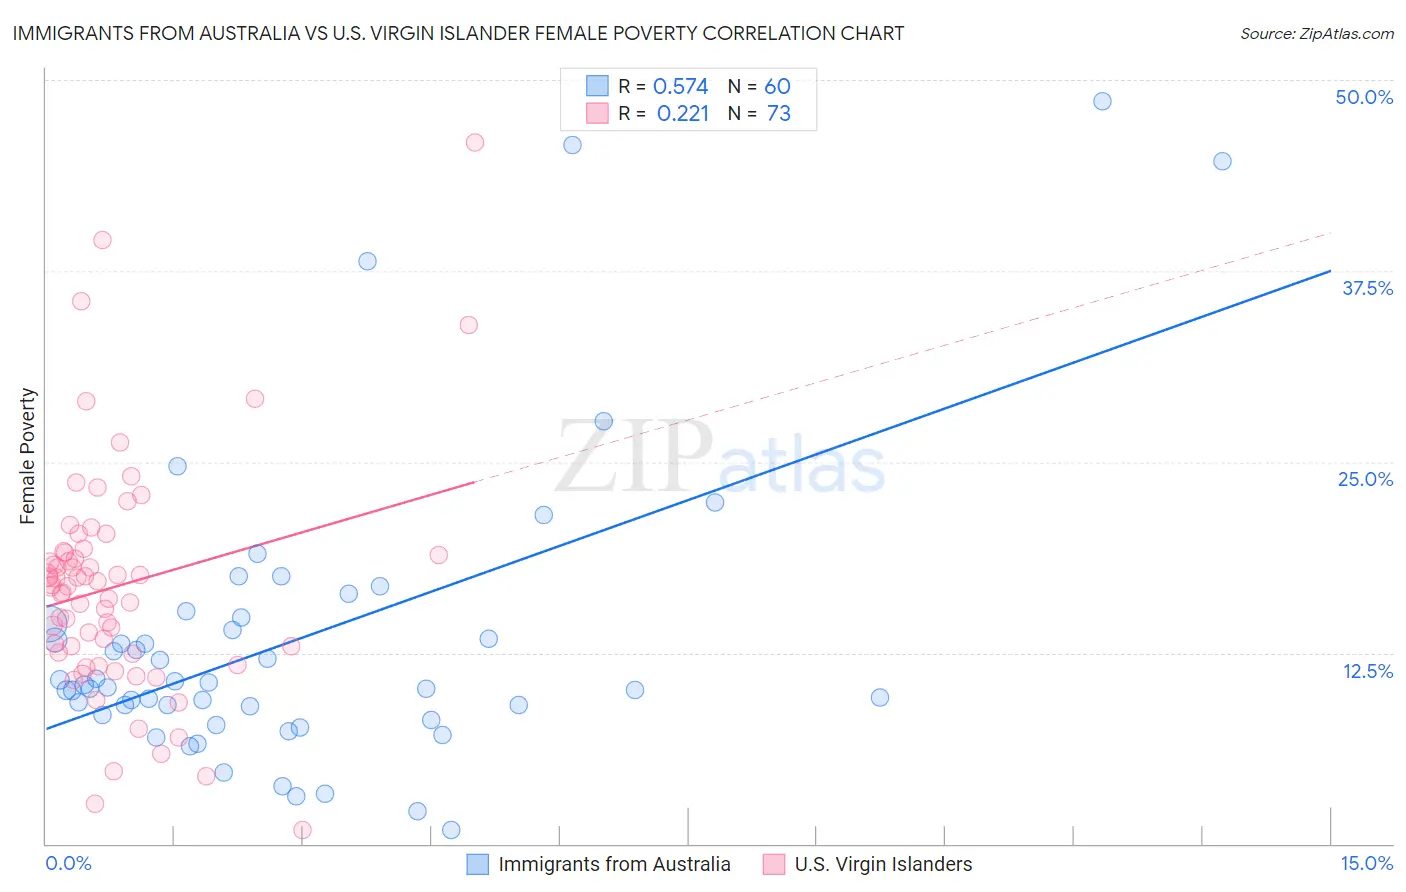
Immigrants from Australia vs U.S. Virgin Islander Female Poverty Correlation Chart
The statistical analysis conducted on geographies consisting of 227,116,794 people shows a substantial positive correlation between the proportion of Immigrants from Australia and poverty level among females in the United States with a correlation coefficient (R) of 0.574 and weighted average of 12.2%. Similarly, the statistical analysis conducted on geographies consisting of 87,511,950 people shows a weak positive correlation between the proportion of U.S. Virgin Islanders and poverty level among females in the United States with a correlation coefficient (R) of 0.221 and weighted average of 17.3%, a difference of 42.2%.
Female Poverty Correlation Summary
| Measurement | Immigrants from Australia | U.S. Virgin Islander |
| Minimum | 0.92% | 0.93% |
| Maximum | 48.6% | 45.9% |
| Range | 47.6% | 45.0% |
| Mean | 13.4% | 16.9% |
| Median | 10.3% | 16.8% |
| Interquartile 25% (IQ1) | 8.7% | 12.5% |
| Interquartile 75% (IQ3) | 14.6% | 19.1% |
| Interquartile Range (IQR) | 5.9% | 6.6% |
| Standard Deviation (Sample) | 9.8% | 7.7% |
| Standard Deviation (Population) | 9.7% | 7.6% |
Similar Demographics by Female Poverty
Demographics Similar to Immigrants from Australia by Female Poverty
In terms of female poverty, the demographic groups most similar to Immigrants from Australia are Immigrants from Asia (12.2%, a difference of 0.0%), Immigrants from Italy (12.2%, a difference of 0.030%), Ukrainian (12.2%, a difference of 0.11%), German (12.2%, a difference of 0.14%), and Indian (Asian) (12.2%, a difference of 0.17%).
| Demographics | Rating | Rank | Female Poverty |
| Immigrants | Austria | 98.7 /100 | #53 | Exceptional 12.0% |
| Immigrants | Philippines | 98.7 /100 | #54 | Exceptional 12.1% |
| Immigrants | Sri Lanka | 98.5 /100 | #55 | Exceptional 12.1% |
| Estonians | 98.3 /100 | #56 | Exceptional 12.1% |
| Immigrants | Serbia | 98.3 /100 | #57 | Exceptional 12.1% |
| Scandinavians | 98.2 /100 | #58 | Exceptional 12.1% |
| Immigrants | Europe | 98.2 /100 | #59 | Exceptional 12.1% |
| Immigrants | Australia | 98.1 /100 | #60 | Exceptional 12.2% |
| Immigrants | Asia | 98.1 /100 | #61 | Exceptional 12.2% |
| Immigrants | Italy | 98.0 /100 | #62 | Exceptional 12.2% |
| Ukrainians | 98.0 /100 | #63 | Exceptional 12.2% |
| Germans | 98.0 /100 | #64 | Exceptional 12.2% |
| Indians (Asian) | 97.9 /100 | #65 | Exceptional 12.2% |
| Austrians | 97.9 /100 | #66 | Exceptional 12.2% |
| Immigrants | Eastern Asia | 97.8 /100 | #67 | Exceptional 12.2% |
Demographics Similar to U.S. Virgin Islanders by Female Poverty
In terms of female poverty, the demographic groups most similar to U.S. Virgin Islanders are Honduran (17.4%, a difference of 0.30%), Immigrants from Congo (17.4%, a difference of 0.49%), Ute (17.5%, a difference of 0.82%), Cajun (17.5%, a difference of 0.83%), and Immigrants from Dominica (17.5%, a difference of 0.91%).
| Demographics | Rating | Rank | Female Poverty |
| Africans | 0.0 /100 | #308 | Tragic 16.9% |
| Immigrants | Mexico | 0.0 /100 | #309 | Tragic 17.0% |
| Creek | 0.0 /100 | #310 | Tragic 17.0% |
| Immigrants | Guatemala | 0.0 /100 | #311 | Tragic 17.0% |
| Immigrants | Somalia | 0.0 /100 | #312 | Tragic 17.0% |
| British West Indians | 0.0 /100 | #313 | Tragic 17.0% |
| Dutch West Indians | 0.0 /100 | #314 | Tragic 17.1% |
| U.S. Virgin Islanders | 0.0 /100 | #315 | Tragic 17.3% |
| Hondurans | 0.0 /100 | #316 | Tragic 17.4% |
| Immigrants | Congo | 0.0 /100 | #317 | Tragic 17.4% |
| Ute | 0.0 /100 | #318 | Tragic 17.5% |
| Cajuns | 0.0 /100 | #319 | Tragic 17.5% |
| Immigrants | Dominica | 0.0 /100 | #320 | Tragic 17.5% |
| Arapaho | 0.0 /100 | #321 | Tragic 17.5% |
| Menominee | 0.0 /100 | #322 | Tragic 17.6% |