Immigrants from Jordan vs U.S. Virgin Islander Female Poverty
COMPARE
Immigrants from Jordan
U.S. Virgin Islander
Female Poverty
Female Poverty Comparison
Immigrants from Jordan
U.S. Virgin Islanders
12.8%
FEMALE POVERTY
86.9/ 100
METRIC RATING
132nd/ 347
METRIC RANK
17.3%
FEMALE POVERTY
0.0/ 100
METRIC RATING
315th/ 347
METRIC RANK
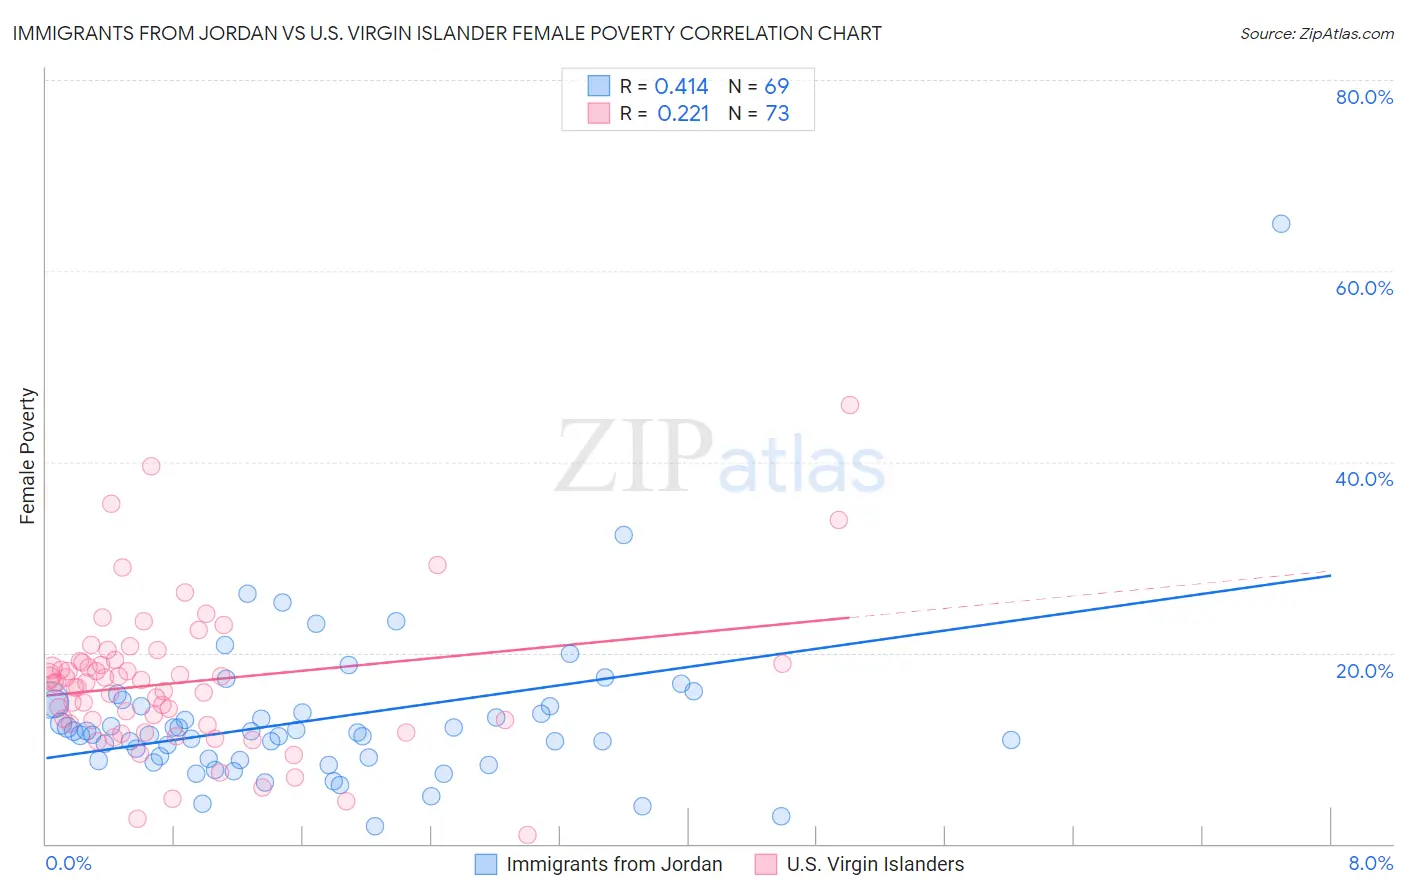
Immigrants from Jordan vs U.S. Virgin Islander Female Poverty Correlation Chart
The statistical analysis conducted on geographies consisting of 181,244,945 people shows a moderate positive correlation between the proportion of Immigrants from Jordan and poverty level among females in the United States with a correlation coefficient (R) of 0.414 and weighted average of 12.8%. Similarly, the statistical analysis conducted on geographies consisting of 87,511,950 people shows a weak positive correlation between the proportion of U.S. Virgin Islanders and poverty level among females in the United States with a correlation coefficient (R) of 0.221 and weighted average of 17.3%, a difference of 34.9%.
Female Poverty Correlation Summary
| Measurement | Immigrants from Jordan | U.S. Virgin Islander |
| Minimum | 1.8% | 0.93% |
| Maximum | 64.9% | 45.9% |
| Range | 63.1% | 45.0% |
| Mean | 13.0% | 16.9% |
| Median | 11.7% | 16.8% |
| Interquartile 25% (IQ1) | 8.8% | 12.5% |
| Interquartile 75% (IQ3) | 14.5% | 19.1% |
| Interquartile Range (IQR) | 5.7% | 6.6% |
| Standard Deviation (Sample) | 8.4% | 7.7% |
| Standard Deviation (Population) | 8.3% | 7.6% |
Similar Demographics by Female Poverty
Demographics Similar to Immigrants from Jordan by Female Poverty
In terms of female poverty, the demographic groups most similar to Immigrants from Jordan are Immigrants from Argentina (12.8%, a difference of 0.010%), Immigrants from Vietnam (12.8%, a difference of 0.050%), Immigrants from Western Europe (12.8%, a difference of 0.060%), Immigrants from Switzerland (12.9%, a difference of 0.22%), and Immigrants from Brazil (12.8%, a difference of 0.24%).
| Demographics | Rating | Rank | Female Poverty |
| Argentineans | 89.1 /100 | #125 | Excellent 12.8% |
| Immigrants | Ukraine | 88.8 /100 | #126 | Excellent 12.8% |
| South Africans | 88.4 /100 | #127 | Excellent 12.8% |
| Immigrants | Belarus | 88.2 /100 | #128 | Excellent 12.8% |
| Immigrants | Brazil | 87.9 /100 | #129 | Excellent 12.8% |
| Immigrants | Vietnam | 87.1 /100 | #130 | Excellent 12.8% |
| Immigrants | Argentina | 87.0 /100 | #131 | Excellent 12.8% |
| Immigrants | Jordan | 86.9 /100 | #132 | Excellent 12.8% |
| Immigrants | Western Europe | 86.6 /100 | #133 | Excellent 12.8% |
| Immigrants | Switzerland | 85.8 /100 | #134 | Excellent 12.9% |
| French | 85.6 /100 | #135 | Excellent 12.9% |
| Peruvians | 85.2 /100 | #136 | Excellent 12.9% |
| Chileans | 84.7 /100 | #137 | Excellent 12.9% |
| Immigrants | France | 83.6 /100 | #138 | Excellent 12.9% |
| Basques | 83.1 /100 | #139 | Excellent 12.9% |
Demographics Similar to U.S. Virgin Islanders by Female Poverty
In terms of female poverty, the demographic groups most similar to U.S. Virgin Islanders are Honduran (17.4%, a difference of 0.30%), Immigrants from Congo (17.4%, a difference of 0.49%), Ute (17.5%, a difference of 0.82%), Cajun (17.5%, a difference of 0.83%), and Immigrants from Dominica (17.5%, a difference of 0.91%).
| Demographics | Rating | Rank | Female Poverty |
| Africans | 0.0 /100 | #308 | Tragic 16.9% |
| Immigrants | Mexico | 0.0 /100 | #309 | Tragic 17.0% |
| Creek | 0.0 /100 | #310 | Tragic 17.0% |
| Immigrants | Guatemala | 0.0 /100 | #311 | Tragic 17.0% |
| Immigrants | Somalia | 0.0 /100 | #312 | Tragic 17.0% |
| British West Indians | 0.0 /100 | #313 | Tragic 17.0% |
| Dutch West Indians | 0.0 /100 | #314 | Tragic 17.1% |
| U.S. Virgin Islanders | 0.0 /100 | #315 | Tragic 17.3% |
| Hondurans | 0.0 /100 | #316 | Tragic 17.4% |
| Immigrants | Congo | 0.0 /100 | #317 | Tragic 17.4% |
| Ute | 0.0 /100 | #318 | Tragic 17.5% |
| Cajuns | 0.0 /100 | #319 | Tragic 17.5% |
| Immigrants | Dominica | 0.0 /100 | #320 | Tragic 17.5% |
| Arapaho | 0.0 /100 | #321 | Tragic 17.5% |
| Menominee | 0.0 /100 | #322 | Tragic 17.6% |