Immigrants from Australia vs Okinawan Female Poverty
COMPARE
Immigrants from Australia
Okinawan
Female Poverty
Female Poverty Comparison
Immigrants from Australia
Okinawans
12.2%
FEMALE POVERTY
98.1/ 100
METRIC RATING
60th/ 347
METRIC RANK
12.4%
FEMALE POVERTY
96.4/ 100
METRIC RATING
87th/ 347
METRIC RANK
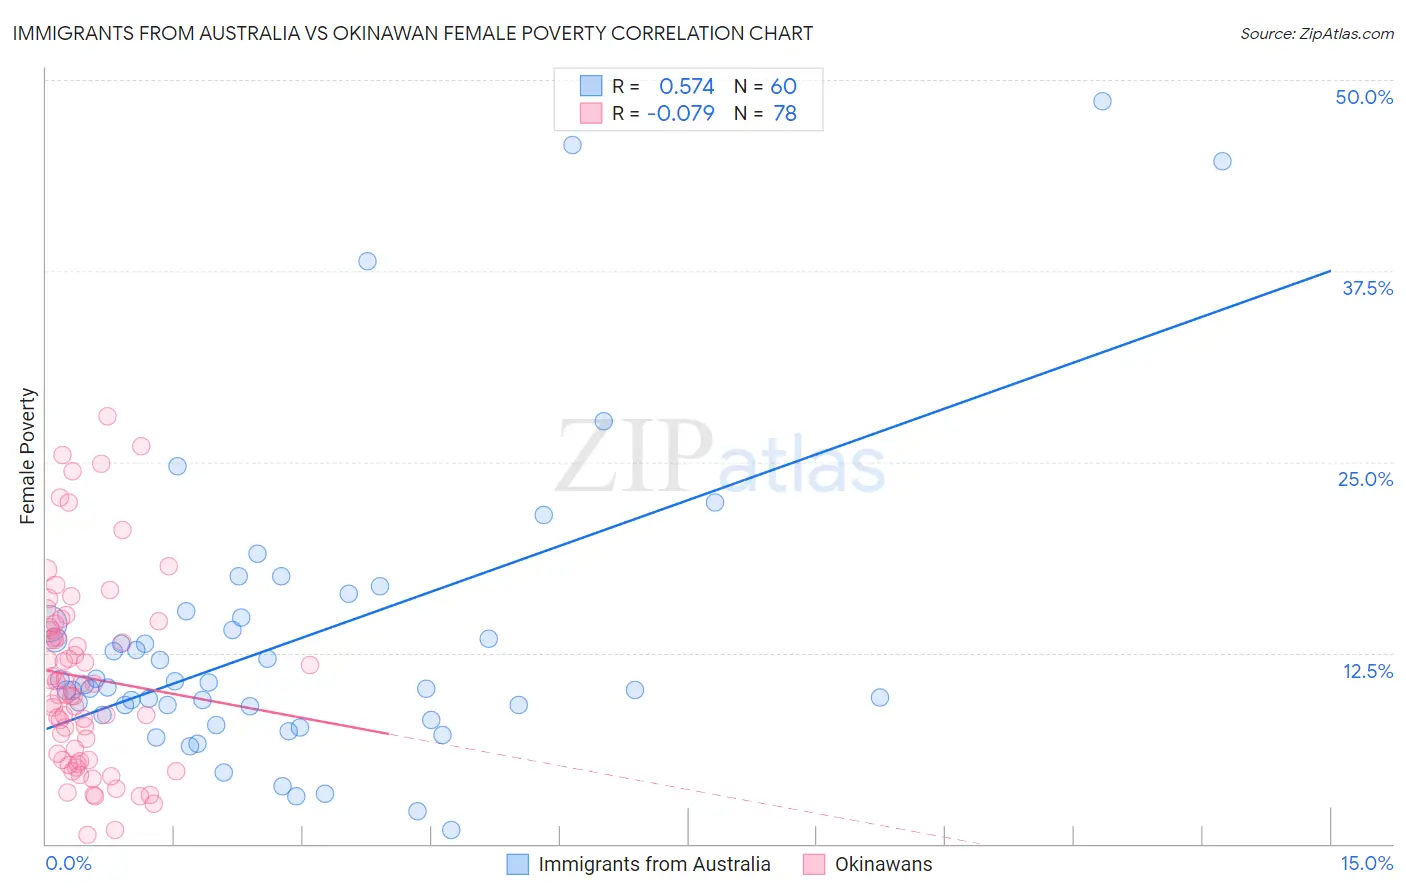
Immigrants from Australia vs Okinawan Female Poverty Correlation Chart
The statistical analysis conducted on geographies consisting of 227,116,794 people shows a substantial positive correlation between the proportion of Immigrants from Australia and poverty level among females in the United States with a correlation coefficient (R) of 0.574 and weighted average of 12.2%. Similarly, the statistical analysis conducted on geographies consisting of 73,724,084 people shows a slight negative correlation between the proportion of Okinawans and poverty level among females in the United States with a correlation coefficient (R) of -0.079 and weighted average of 12.4%, a difference of 1.7%.
Female Poverty Correlation Summary
| Measurement | Immigrants from Australia | Okinawan |
| Minimum | 0.92% | 0.59% |
| Maximum | 48.6% | 28.0% |
| Range | 47.6% | 27.4% |
| Mean | 13.4% | 10.9% |
| Median | 10.3% | 10.1% |
| Interquartile 25% (IQ1) | 8.7% | 5.5% |
| Interquartile 75% (IQ3) | 14.6% | 14.2% |
| Interquartile Range (IQR) | 5.9% | 8.7% |
| Standard Deviation (Sample) | 9.8% | 6.3% |
| Standard Deviation (Population) | 9.7% | 6.2% |
Similar Demographics by Female Poverty
Demographics Similar to Immigrants from Australia by Female Poverty
In terms of female poverty, the demographic groups most similar to Immigrants from Australia are Immigrants from Asia (12.2%, a difference of 0.0%), Immigrants from Italy (12.2%, a difference of 0.030%), Ukrainian (12.2%, a difference of 0.11%), German (12.2%, a difference of 0.14%), and Indian (Asian) (12.2%, a difference of 0.17%).
| Demographics | Rating | Rank | Female Poverty |
| Immigrants | Austria | 98.7 /100 | #53 | Exceptional 12.0% |
| Immigrants | Philippines | 98.7 /100 | #54 | Exceptional 12.1% |
| Immigrants | Sri Lanka | 98.5 /100 | #55 | Exceptional 12.1% |
| Estonians | 98.3 /100 | #56 | Exceptional 12.1% |
| Immigrants | Serbia | 98.3 /100 | #57 | Exceptional 12.1% |
| Scandinavians | 98.2 /100 | #58 | Exceptional 12.1% |
| Immigrants | Europe | 98.2 /100 | #59 | Exceptional 12.1% |
| Immigrants | Australia | 98.1 /100 | #60 | Exceptional 12.2% |
| Immigrants | Asia | 98.1 /100 | #61 | Exceptional 12.2% |
| Immigrants | Italy | 98.0 /100 | #62 | Exceptional 12.2% |
| Ukrainians | 98.0 /100 | #63 | Exceptional 12.2% |
| Germans | 98.0 /100 | #64 | Exceptional 12.2% |
| Indians (Asian) | 97.9 /100 | #65 | Exceptional 12.2% |
| Austrians | 97.9 /100 | #66 | Exceptional 12.2% |
| Immigrants | Eastern Asia | 97.8 /100 | #67 | Exceptional 12.2% |
Demographics Similar to Okinawans by Female Poverty
In terms of female poverty, the demographic groups most similar to Okinawans are Dutch (12.4%, a difference of 0.020%), Irish (12.4%, a difference of 0.050%), Finnish (12.4%, a difference of 0.050%), Northern European (12.4%, a difference of 0.10%), and English (12.4%, a difference of 0.24%).
| Demographics | Rating | Rank | Female Poverty |
| Slovaks | 97.1 /100 | #80 | Exceptional 12.3% |
| Immigrants | Sweden | 97.1 /100 | #81 | Exceptional 12.3% |
| Jordanians | 97.1 /100 | #82 | Exceptional 12.3% |
| Immigrants | England | 96.9 /100 | #83 | Exceptional 12.3% |
| Northern Europeans | 96.6 /100 | #84 | Exceptional 12.4% |
| Irish | 96.5 /100 | #85 | Exceptional 12.4% |
| Dutch | 96.5 /100 | #86 | Exceptional 12.4% |
| Okinawans | 96.4 /100 | #87 | Exceptional 12.4% |
| Finns | 96.4 /100 | #88 | Exceptional 12.4% |
| English | 96.1 /100 | #89 | Exceptional 12.4% |
| Immigrants | Denmark | 95.8 /100 | #90 | Exceptional 12.4% |
| Belgians | 95.8 /100 | #91 | Exceptional 12.4% |
| Czechoslovakians | 95.7 /100 | #92 | Exceptional 12.4% |
| Immigrants | Egypt | 95.5 /100 | #93 | Exceptional 12.5% |
| Immigrants | Indonesia | 95.4 /100 | #94 | Exceptional 12.5% |