Immigrants from Australia vs Russian Female Poverty
COMPARE
Immigrants from Australia
Russian
Female Poverty
Female Poverty Comparison
Immigrants from Australia
Russians
12.2%
FEMALE POVERTY
98.1/ 100
METRIC RATING
60th/ 347
METRIC RANK
11.8%
FEMALE POVERTY
99.3/ 100
METRIC RATING
38th/ 347
METRIC RANK
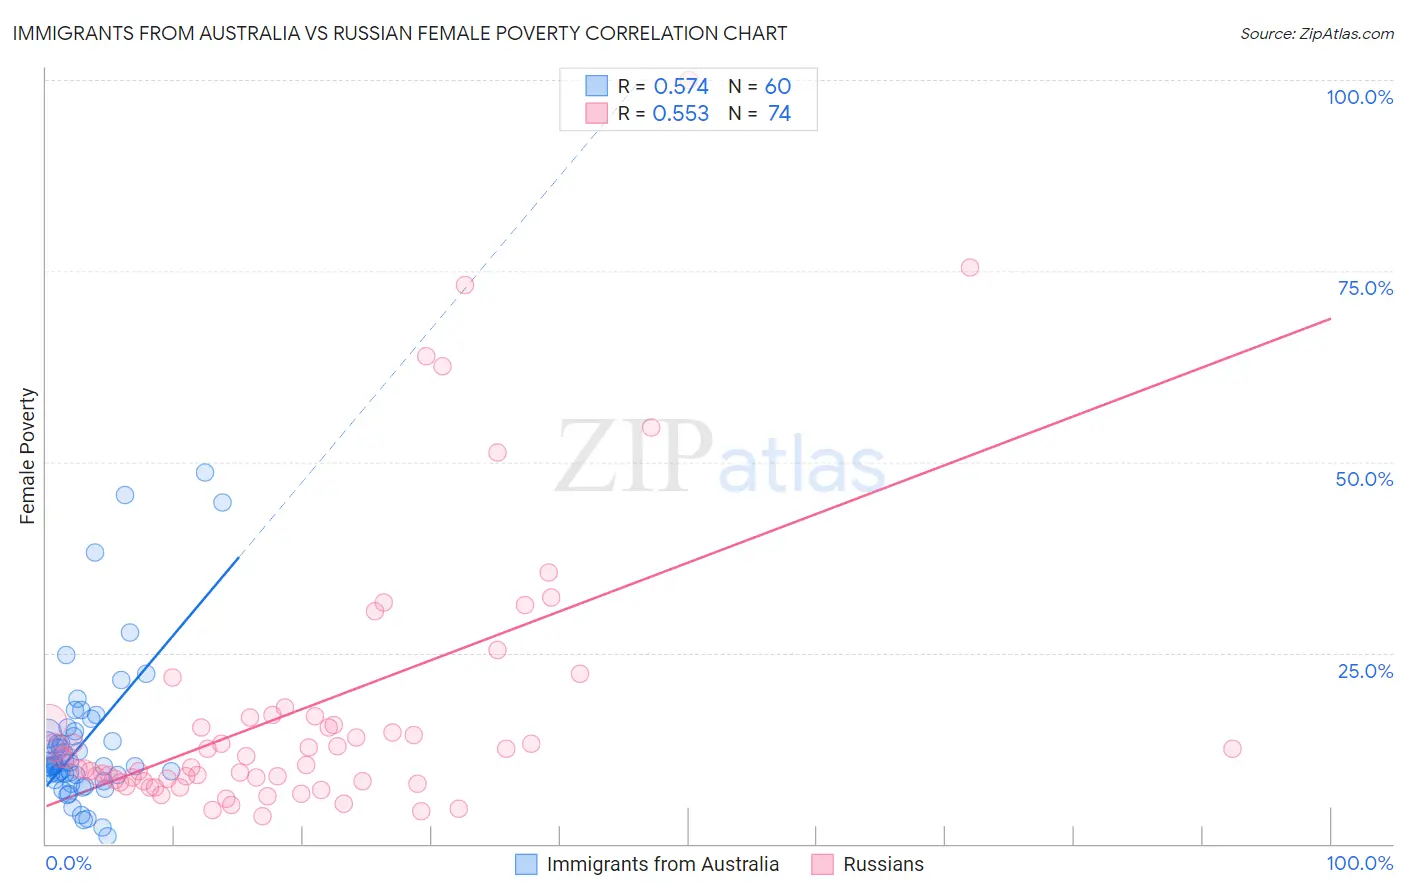
Immigrants from Australia vs Russian Female Poverty Correlation Chart
The statistical analysis conducted on geographies consisting of 227,116,794 people shows a substantial positive correlation between the proportion of Immigrants from Australia and poverty level among females in the United States with a correlation coefficient (R) of 0.574 and weighted average of 12.2%. Similarly, the statistical analysis conducted on geographies consisting of 511,408,549 people shows a substantial positive correlation between the proportion of Russians and poverty level among females in the United States with a correlation coefficient (R) of 0.553 and weighted average of 11.8%, a difference of 3.0%.
Female Poverty Correlation Summary
| Measurement | Immigrants from Australia | Russian |
| Minimum | 0.92% | 3.6% |
| Maximum | 48.6% | 100.0% |
| Range | 47.6% | 96.4% |
| Mean | 13.4% | 17.7% |
| Median | 10.3% | 11.4% |
| Interquartile 25% (IQ1) | 8.7% | 8.2% |
| Interquartile 75% (IQ3) | 14.6% | 16.5% |
| Interquartile Range (IQR) | 5.9% | 8.2% |
| Standard Deviation (Sample) | 9.8% | 18.5% |
| Standard Deviation (Population) | 9.7% | 18.4% |
Similar Demographics by Female Poverty
Demographics Similar to Immigrants from Australia by Female Poverty
In terms of female poverty, the demographic groups most similar to Immigrants from Australia are Immigrants from Asia (12.2%, a difference of 0.0%), Immigrants from Italy (12.2%, a difference of 0.030%), Ukrainian (12.2%, a difference of 0.11%), German (12.2%, a difference of 0.14%), and Indian (Asian) (12.2%, a difference of 0.17%).
| Demographics | Rating | Rank | Female Poverty |
| Immigrants | Austria | 98.7 /100 | #53 | Exceptional 12.0% |
| Immigrants | Philippines | 98.7 /100 | #54 | Exceptional 12.1% |
| Immigrants | Sri Lanka | 98.5 /100 | #55 | Exceptional 12.1% |
| Estonians | 98.3 /100 | #56 | Exceptional 12.1% |
| Immigrants | Serbia | 98.3 /100 | #57 | Exceptional 12.1% |
| Scandinavians | 98.2 /100 | #58 | Exceptional 12.1% |
| Immigrants | Europe | 98.2 /100 | #59 | Exceptional 12.1% |
| Immigrants | Australia | 98.1 /100 | #60 | Exceptional 12.2% |
| Immigrants | Asia | 98.1 /100 | #61 | Exceptional 12.2% |
| Immigrants | Italy | 98.0 /100 | #62 | Exceptional 12.2% |
| Ukrainians | 98.0 /100 | #63 | Exceptional 12.2% |
| Germans | 98.0 /100 | #64 | Exceptional 12.2% |
| Indians (Asian) | 97.9 /100 | #65 | Exceptional 12.2% |
| Austrians | 97.9 /100 | #66 | Exceptional 12.2% |
| Immigrants | Eastern Asia | 97.8 /100 | #67 | Exceptional 12.2% |
Demographics Similar to Russians by Female Poverty
In terms of female poverty, the demographic groups most similar to Russians are Immigrants from Greece (11.8%, a difference of 0.020%), Immigrants from Pakistan (11.8%, a difference of 0.11%), Immigrants from Poland (11.8%, a difference of 0.21%), Macedonian (11.8%, a difference of 0.26%), and Immigrants from Iran (11.8%, a difference of 0.28%).
| Demographics | Rating | Rank | Female Poverty |
| Poles | 99.5 /100 | #31 | Exceptional 11.7% |
| Danes | 99.5 /100 | #32 | Exceptional 11.7% |
| Cypriots | 99.5 /100 | #33 | Exceptional 11.8% |
| Immigrants | Singapore | 99.4 /100 | #34 | Exceptional 11.8% |
| Immigrants | Iran | 99.4 /100 | #35 | Exceptional 11.8% |
| Immigrants | Pakistan | 99.4 /100 | #36 | Exceptional 11.8% |
| Immigrants | Greece | 99.3 /100 | #37 | Exceptional 11.8% |
| Russians | 99.3 /100 | #38 | Exceptional 11.8% |
| Immigrants | Poland | 99.3 /100 | #39 | Exceptional 11.8% |
| Macedonians | 99.3 /100 | #40 | Exceptional 11.8% |
| Czechs | 99.2 /100 | #41 | Exceptional 11.9% |
| Immigrants | Moldova | 99.2 /100 | #42 | Exceptional 11.9% |
| Koreans | 99.2 /100 | #43 | Exceptional 11.9% |
| Tongans | 99.2 /100 | #44 | Exceptional 11.9% |
| Immigrants | Czechoslovakia | 99.2 /100 | #45 | Exceptional 11.9% |