Immigrants from Argentina vs Danish Male Poverty
COMPARE
Immigrants from Argentina
Danish
Male Poverty
Male Poverty Comparison
Immigrants from Argentina
Danes
10.6%
MALE POVERTY
89.8/ 100
METRIC RATING
111th/ 347
METRIC RANK
9.7%
MALE POVERTY
99.6/ 100
METRIC RATING
27th/ 347
METRIC RANK
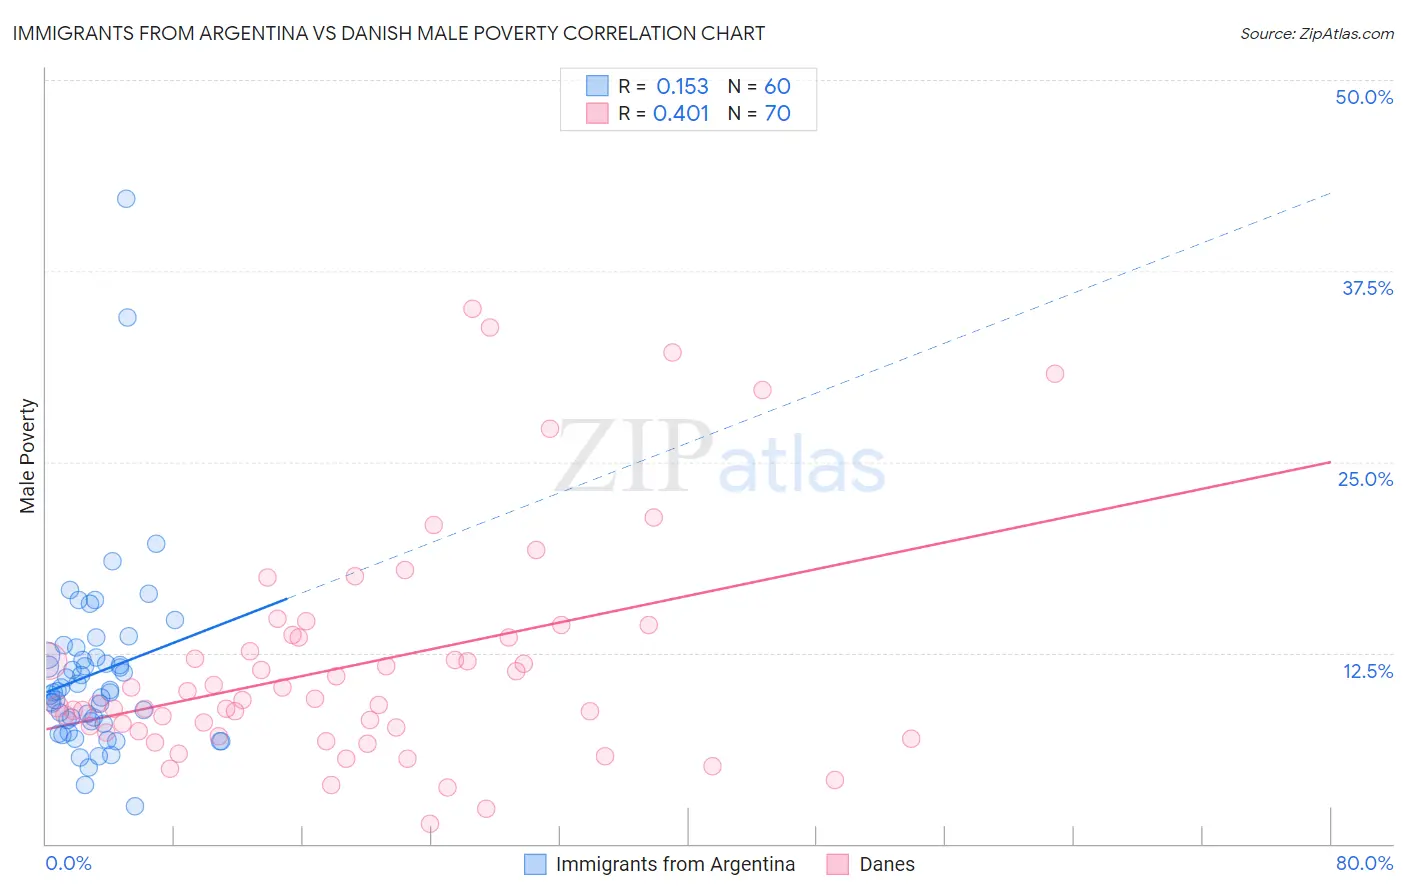
Immigrants from Argentina vs Danish Male Poverty Correlation Chart
The statistical analysis conducted on geographies consisting of 264,308,619 people shows a poor positive correlation between the proportion of Immigrants from Argentina and poverty level among males in the United States with a correlation coefficient (R) of 0.153 and weighted average of 10.6%. Similarly, the statistical analysis conducted on geographies consisting of 473,491,649 people shows a moderate positive correlation between the proportion of Danes and poverty level among males in the United States with a correlation coefficient (R) of 0.401 and weighted average of 9.7%, a difference of 9.3%.
Male Poverty Correlation Summary
| Measurement | Immigrants from Argentina | Danish |
| Minimum | 2.5% | 1.3% |
| Maximum | 42.3% | 35.0% |
| Range | 39.8% | 33.7% |
| Mean | 11.2% | 11.7% |
| Median | 9.9% | 9.3% |
| Interquartile 25% (IQ1) | 7.9% | 7.4% |
| Interquartile 75% (IQ3) | 12.3% | 13.5% |
| Interquartile Range (IQR) | 4.4% | 6.1% |
| Standard Deviation (Sample) | 6.2% | 7.3% |
| Standard Deviation (Population) | 6.2% | 7.3% |
Similar Demographics by Male Poverty
Demographics Similar to Immigrants from Argentina by Male Poverty
In terms of male poverty, the demographic groups most similar to Immigrants from Argentina are Immigrants from Turkey (10.6%, a difference of 0.080%), Argentinean (10.6%, a difference of 0.11%), Palestinian (10.6%, a difference of 0.18%), Immigrants from Brazil (10.6%, a difference of 0.20%), and Albanian (10.6%, a difference of 0.24%).
| Demographics | Rating | Rank | Male Poverty |
| Welsh | 91.6 /100 | #104 | Exceptional 10.5% |
| Canadians | 91.6 /100 | #105 | Exceptional 10.5% |
| Immigrants | Southern Europe | 91.3 /100 | #106 | Exceptional 10.5% |
| Laotians | 91.2 /100 | #107 | Exceptional 10.5% |
| Portuguese | 91.0 /100 | #108 | Exceptional 10.6% |
| Albanians | 90.6 /100 | #109 | Exceptional 10.6% |
| Argentineans | 90.1 /100 | #110 | Exceptional 10.6% |
| Immigrants | Argentina | 89.8 /100 | #111 | Excellent 10.6% |
| Immigrants | Turkey | 89.5 /100 | #112 | Excellent 10.6% |
| Palestinians | 89.1 /100 | #113 | Excellent 10.6% |
| Immigrants | Brazil | 89.0 /100 | #114 | Excellent 10.6% |
| Immigrants | Russia | 88.6 /100 | #115 | Excellent 10.6% |
| Sri Lankans | 88.1 /100 | #116 | Excellent 10.6% |
| Immigrants | South Eastern Asia | 88.1 /100 | #117 | Excellent 10.6% |
| Okinawans | 87.6 /100 | #118 | Excellent 10.7% |
Demographics Similar to Danes by Male Poverty
In terms of male poverty, the demographic groups most similar to Danes are Immigrants from Korea (9.7%, a difference of 0.080%), Greek (9.7%, a difference of 0.12%), Burmese (9.7%, a difference of 0.13%), Polish (9.7%, a difference of 0.20%), and Tongan (9.7%, a difference of 0.22%).
| Demographics | Rating | Rank | Male Poverty |
| Latvians | 99.7 /100 | #20 | Exceptional 9.6% |
| Immigrants | Scotland | 99.7 /100 | #21 | Exceptional 9.6% |
| Croatians | 99.7 /100 | #22 | Exceptional 9.6% |
| Italians | 99.7 /100 | #23 | Exceptional 9.6% |
| Swedes | 99.7 /100 | #24 | Exceptional 9.6% |
| Eastern Europeans | 99.6 /100 | #25 | Exceptional 9.6% |
| Burmese | 99.6 /100 | #26 | Exceptional 9.7% |
| Danes | 99.6 /100 | #27 | Exceptional 9.7% |
| Immigrants | Korea | 99.6 /100 | #28 | Exceptional 9.7% |
| Greeks | 99.6 /100 | #29 | Exceptional 9.7% |
| Poles | 99.5 /100 | #30 | Exceptional 9.7% |
| Tongans | 99.5 /100 | #31 | Exceptional 9.7% |
| Macedonians | 99.5 /100 | #32 | Exceptional 9.7% |
| Immigrants | Northern Europe | 99.5 /100 | #33 | Exceptional 9.7% |
| Immigrants | Poland | 99.5 /100 | #34 | Exceptional 9.8% |