Immigrants from Argentina vs Bermudan Child Poverty Under the Age of 5
COMPARE
Immigrants from Argentina
Bermudan
Child Poverty Under the Age of 5
Child Poverty Under the Age of 5 Comparison
Immigrants from Argentina
Bermudans
15.4%
CHILD POVERTY UNDER THE AGE OF 5
98.5/ 100
METRIC RATING
75th/ 347
METRIC RANK
19.2%
CHILD POVERTY UNDER THE AGE OF 5
1.2/ 100
METRIC RATING
231st/ 347
METRIC RANK
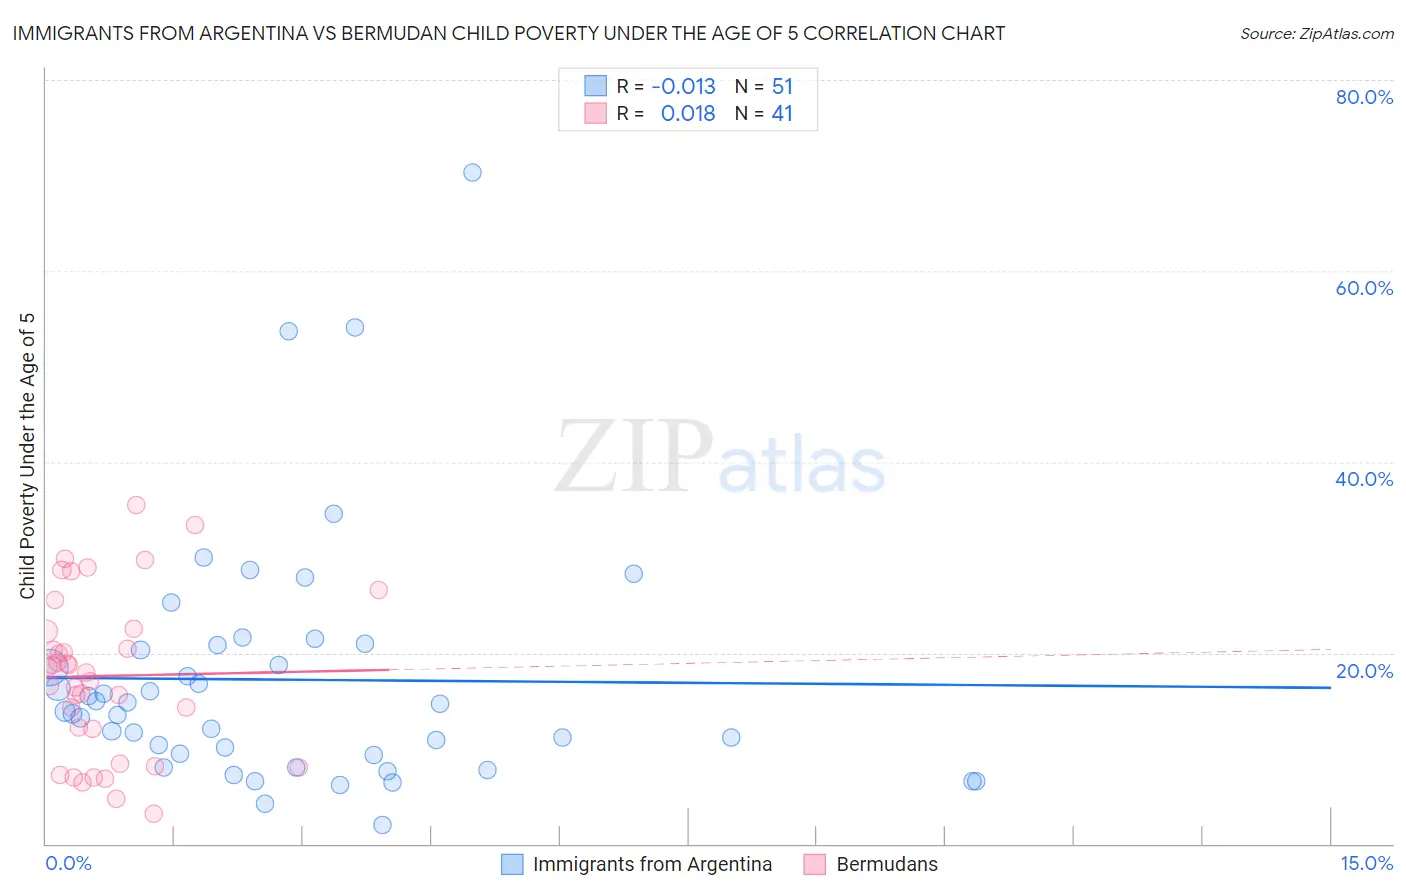
Immigrants from Argentina vs Bermudan Child Poverty Under the Age of 5 Correlation Chart
The statistical analysis conducted on geographies consisting of 256,145,971 people shows no correlation between the proportion of Immigrants from Argentina and poverty level among children under the age of 5 in the United States with a correlation coefficient (R) of -0.013 and weighted average of 15.4%. Similarly, the statistical analysis conducted on geographies consisting of 55,495,700 people shows no correlation between the proportion of Bermudans and poverty level among children under the age of 5 in the United States with a correlation coefficient (R) of 0.018 and weighted average of 19.2%, a difference of 25.0%.
Child Poverty Under the Age of 5 Correlation Summary
| Measurement | Immigrants from Argentina | Bermudan |
| Minimum | 2.0% | 3.2% |
| Maximum | 70.4% | 35.5% |
| Range | 68.4% | 32.4% |
| Mean | 17.2% | 17.6% |
| Median | 13.9% | 18.0% |
| Interquartile 25% (IQ1) | 9.3% | 10.2% |
| Interquartile 75% (IQ3) | 20.8% | 22.4% |
| Interquartile Range (IQR) | 11.5% | 12.2% |
| Standard Deviation (Sample) | 13.0% | 8.3% |
| Standard Deviation (Population) | 12.9% | 8.2% |
Similar Demographics by Child Poverty Under the Age of 5
Demographics Similar to Immigrants from Argentina by Child Poverty Under the Age of 5
In terms of child poverty under the age of 5, the demographic groups most similar to Immigrants from Argentina are Croatian (15.4%, a difference of 0.0%), Argentinean (15.4%, a difference of 0.15%), Immigrants from Turkey (15.4%, a difference of 0.21%), Immigrants from Ukraine (15.3%, a difference of 0.51%), and Sri Lankan (15.5%, a difference of 0.54%).
| Demographics | Rating | Rank | Child Poverty Under the Age of 5 |
| Zimbabweans | 99.0 /100 | #68 | Exceptional 15.2% |
| Lithuanians | 99.0 /100 | #69 | Exceptional 15.2% |
| Immigrants | Belgium | 98.8 /100 | #70 | Exceptional 15.3% |
| Immigrants | Egypt | 98.8 /100 | #71 | Exceptional 15.3% |
| Immigrants | Sweden | 98.8 /100 | #72 | Exceptional 15.3% |
| Immigrants | Ukraine | 98.7 /100 | #73 | Exceptional 15.3% |
| Argentineans | 98.5 /100 | #74 | Exceptional 15.4% |
| Immigrants | Argentina | 98.5 /100 | #75 | Exceptional 15.4% |
| Croatians | 98.5 /100 | #76 | Exceptional 15.4% |
| Immigrants | Turkey | 98.3 /100 | #77 | Exceptional 15.4% |
| Sri Lankans | 98.1 /100 | #78 | Exceptional 15.5% |
| Australians | 98.0 /100 | #79 | Exceptional 15.5% |
| Italians | 97.9 /100 | #80 | Exceptional 15.5% |
| Czechs | 97.8 /100 | #81 | Exceptional 15.5% |
| Immigrants | Italy | 97.7 /100 | #82 | Exceptional 15.6% |
Demographics Similar to Bermudans by Child Poverty Under the Age of 5
In terms of child poverty under the age of 5, the demographic groups most similar to Bermudans are Ecuadorian (19.2%, a difference of 0.050%), Ghanaian (19.2%, a difference of 0.090%), Immigrants from Sudan (19.2%, a difference of 0.17%), Cape Verdean (19.1%, a difference of 0.48%), and Trinidadian and Tobagonian (19.3%, a difference of 0.56%).
| Demographics | Rating | Rank | Child Poverty Under the Age of 5 |
| Nicaraguans | 1.6 /100 | #224 | Tragic 19.1% |
| Nigerians | 1.6 /100 | #225 | Tragic 19.1% |
| Immigrants | Eritrea | 1.5 /100 | #226 | Tragic 19.1% |
| Cape Verdeans | 1.4 /100 | #227 | Tragic 19.1% |
| Immigrants | Sudan | 1.3 /100 | #228 | Tragic 19.2% |
| Ghanaians | 1.2 /100 | #229 | Tragic 19.2% |
| Ecuadorians | 1.2 /100 | #230 | Tragic 19.2% |
| Bermudans | 1.2 /100 | #231 | Tragic 19.2% |
| Trinidadians and Tobagonians | 0.9 /100 | #232 | Tragic 19.3% |
| Sudanese | 0.9 /100 | #233 | Tragic 19.3% |
| Immigrants | Micronesia | 0.9 /100 | #234 | Tragic 19.4% |
| Immigrants | Laos | 0.8 /100 | #235 | Tragic 19.4% |
| Immigrants | Trinidad and Tobago | 0.8 /100 | #236 | Tragic 19.4% |
| Immigrants | Cabo Verde | 0.6 /100 | #237 | Tragic 19.5% |
| Salvadorans | 0.6 /100 | #238 | Tragic 19.5% |