Immigrants from Argentina vs Immigrants from Ukraine Child Poverty Under the Age of 5
COMPARE
Immigrants from Argentina
Immigrants from Ukraine
Child Poverty Under the Age of 5
Child Poverty Under the Age of 5 Comparison
Immigrants from Argentina
Immigrants from Ukraine
15.4%
CHILD POVERTY UNDER THE AGE OF 5
98.5/ 100
METRIC RATING
75th/ 347
METRIC RANK
15.3%
CHILD POVERTY UNDER THE AGE OF 5
98.7/ 100
METRIC RATING
73rd/ 347
METRIC RANK
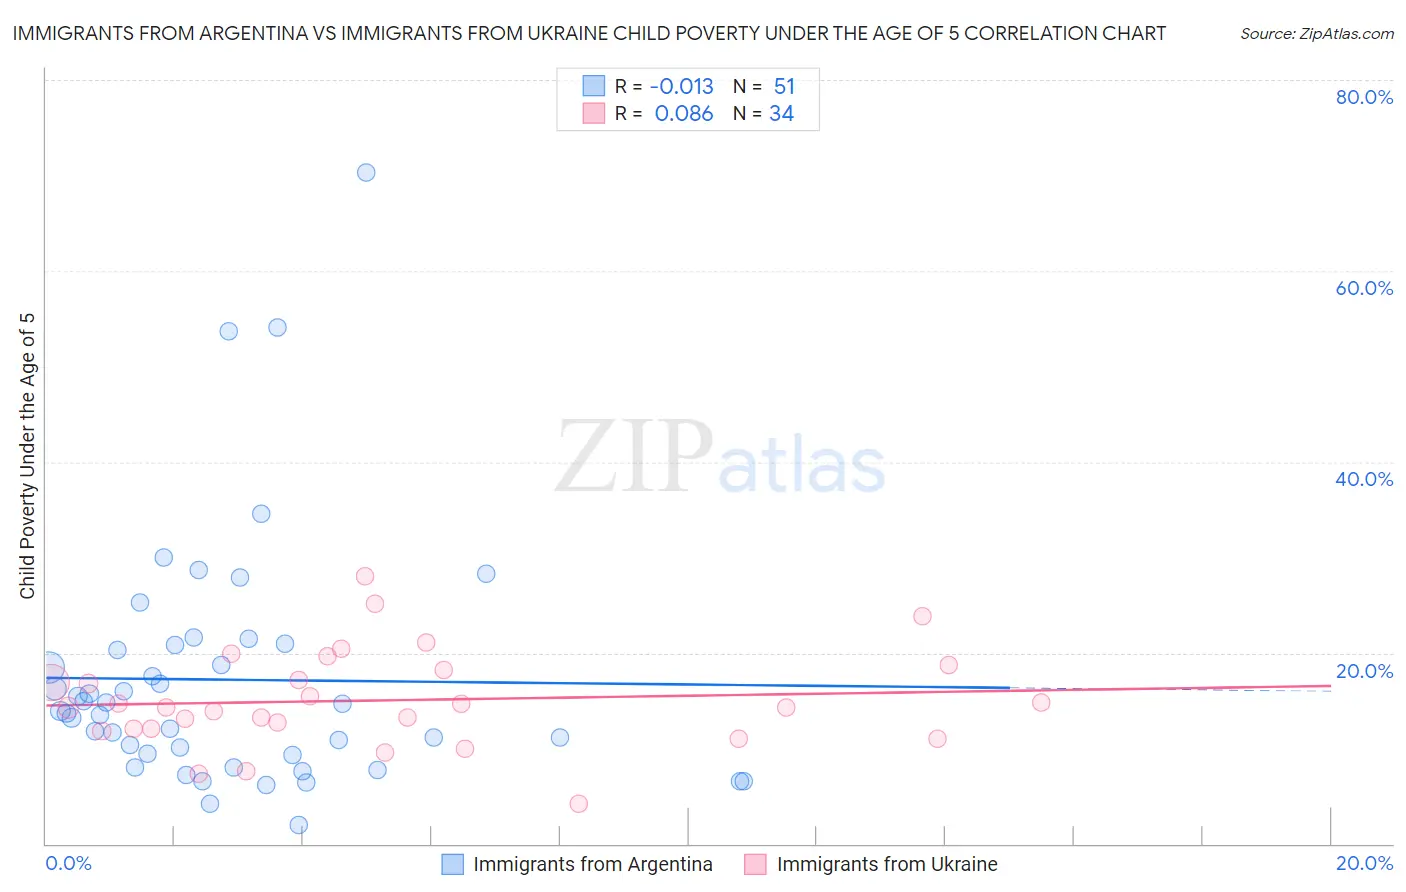
Immigrants from Argentina vs Immigrants from Ukraine Child Poverty Under the Age of 5 Correlation Chart
The statistical analysis conducted on geographies consisting of 256,145,971 people shows no correlation between the proportion of Immigrants from Argentina and poverty level among children under the age of 5 in the United States with a correlation coefficient (R) of -0.013 and weighted average of 15.4%. Similarly, the statistical analysis conducted on geographies consisting of 277,960,196 people shows a slight positive correlation between the proportion of Immigrants from Ukraine and poverty level among children under the age of 5 in the United States with a correlation coefficient (R) of 0.086 and weighted average of 15.3%, a difference of 0.51%.
Child Poverty Under the Age of 5 Correlation Summary
| Measurement | Immigrants from Argentina | Immigrants from Ukraine |
| Minimum | 2.0% | 4.2% |
| Maximum | 70.4% | 28.0% |
| Range | 68.4% | 23.8% |
| Mean | 17.2% | 15.0% |
| Median | 13.9% | 14.3% |
| Interquartile 25% (IQ1) | 9.3% | 12.0% |
| Interquartile 75% (IQ3) | 20.8% | 18.2% |
| Interquartile Range (IQR) | 11.5% | 6.2% |
| Standard Deviation (Sample) | 13.0% | 5.1% |
| Standard Deviation (Population) | 12.9% | 5.0% |
Demographics Similar to Immigrants from Argentina and Immigrants from Ukraine by Child Poverty Under the Age of 5
In terms of child poverty under the age of 5, the demographic groups most similar to Immigrants from Argentina are Croatian (15.4%, a difference of 0.0%), Argentinean (15.4%, a difference of 0.15%), Immigrants from Turkey (15.4%, a difference of 0.21%), Sri Lankan (15.5%, a difference of 0.54%), and Immigrants from Sweden (15.3%, a difference of 0.74%). Similarly, the demographic groups most similar to Immigrants from Ukraine are Immigrants from Sweden (15.3%, a difference of 0.23%), Immigrants from Belgium (15.3%, a difference of 0.30%), Immigrants from Egypt (15.3%, a difference of 0.30%), Argentinean (15.4%, a difference of 0.36%), and Croatian (15.4%, a difference of 0.51%).
| Demographics | Rating | Rank | Child Poverty Under the Age of 5 |
| Immigrants | Romania | 99.1 /100 | #64 | Exceptional 15.2% |
| Immigrants | Fiji | 99.0 /100 | #65 | Exceptional 15.2% |
| Immigrants | Scotland | 99.0 /100 | #66 | Exceptional 15.2% |
| Greeks | 99.0 /100 | #67 | Exceptional 15.2% |
| Zimbabweans | 99.0 /100 | #68 | Exceptional 15.2% |
| Lithuanians | 99.0 /100 | #69 | Exceptional 15.2% |
| Immigrants | Belgium | 98.8 /100 | #70 | Exceptional 15.3% |
| Immigrants | Egypt | 98.8 /100 | #71 | Exceptional 15.3% |
| Immigrants | Sweden | 98.8 /100 | #72 | Exceptional 15.3% |
| Immigrants | Ukraine | 98.7 /100 | #73 | Exceptional 15.3% |
| Argentineans | 98.5 /100 | #74 | Exceptional 15.4% |
| Immigrants | Argentina | 98.5 /100 | #75 | Exceptional 15.4% |
| Croatians | 98.5 /100 | #76 | Exceptional 15.4% |
| Immigrants | Turkey | 98.3 /100 | #77 | Exceptional 15.4% |
| Sri Lankans | 98.1 /100 | #78 | Exceptional 15.5% |
| Australians | 98.0 /100 | #79 | Exceptional 15.5% |
| Italians | 97.9 /100 | #80 | Exceptional 15.5% |
| Czechs | 97.8 /100 | #81 | Exceptional 15.5% |
| Immigrants | Italy | 97.7 /100 | #82 | Exceptional 15.6% |
| Chileans | 97.6 /100 | #83 | Exceptional 15.6% |
| Immigrants | Netherlands | 97.6 /100 | #84 | Exceptional 15.6% |