Immigrants from Sweden vs Bermudan Child Poverty Under the Age of 5
COMPARE
Immigrants from Sweden
Bermudan
Child Poverty Under the Age of 5
Child Poverty Under the Age of 5 Comparison
Immigrants from Sweden
Bermudans
15.3%
CHILD POVERTY UNDER THE AGE OF 5
98.8/ 100
METRIC RATING
72nd/ 347
METRIC RANK
19.2%
CHILD POVERTY UNDER THE AGE OF 5
1.2/ 100
METRIC RATING
231st/ 347
METRIC RANK
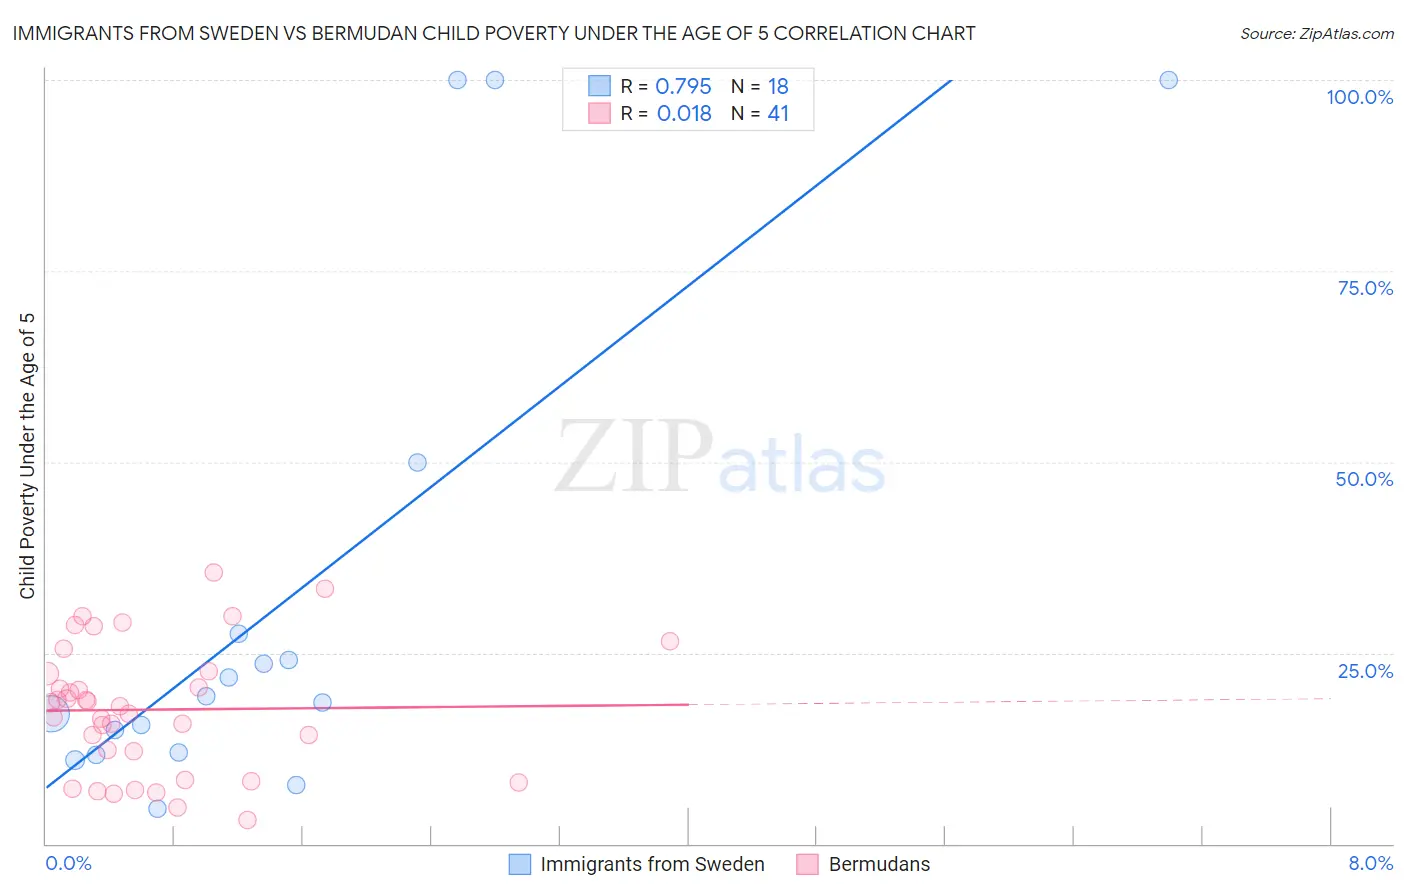
Immigrants from Sweden vs Bermudan Child Poverty Under the Age of 5 Correlation Chart
The statistical analysis conducted on geographies consisting of 159,371,189 people shows a strong positive correlation between the proportion of Immigrants from Sweden and poverty level among children under the age of 5 in the United States with a correlation coefficient (R) of 0.795 and weighted average of 15.3%. Similarly, the statistical analysis conducted on geographies consisting of 55,495,700 people shows no correlation between the proportion of Bermudans and poverty level among children under the age of 5 in the United States with a correlation coefficient (R) of 0.018 and weighted average of 19.2%, a difference of 25.9%.
Child Poverty Under the Age of 5 Correlation Summary
| Measurement | Immigrants from Sweden | Bermudan |
| Minimum | 4.7% | 3.2% |
| Maximum | 100.0% | 35.5% |
| Range | 95.3% | 32.4% |
| Mean | 32.2% | 17.6% |
| Median | 18.9% | 18.0% |
| Interquartile 25% (IQ1) | 12.0% | 10.2% |
| Interquartile 75% (IQ3) | 27.5% | 22.4% |
| Interquartile Range (IQR) | 15.4% | 12.2% |
| Standard Deviation (Sample) | 32.7% | 8.3% |
| Standard Deviation (Population) | 31.8% | 8.2% |
Similar Demographics by Child Poverty Under the Age of 5
Demographics Similar to Immigrants from Sweden by Child Poverty Under the Age of 5
In terms of child poverty under the age of 5, the demographic groups most similar to Immigrants from Sweden are Immigrants from Belgium (15.3%, a difference of 0.070%), Immigrants from Egypt (15.3%, a difference of 0.070%), Immigrants from Ukraine (15.3%, a difference of 0.23%), Lithuanian (15.2%, a difference of 0.50%), and Greek (15.2%, a difference of 0.52%).
| Demographics | Rating | Rank | Child Poverty Under the Age of 5 |
| Immigrants | Fiji | 99.0 /100 | #65 | Exceptional 15.2% |
| Immigrants | Scotland | 99.0 /100 | #66 | Exceptional 15.2% |
| Greeks | 99.0 /100 | #67 | Exceptional 15.2% |
| Zimbabweans | 99.0 /100 | #68 | Exceptional 15.2% |
| Lithuanians | 99.0 /100 | #69 | Exceptional 15.2% |
| Immigrants | Belgium | 98.8 /100 | #70 | Exceptional 15.3% |
| Immigrants | Egypt | 98.8 /100 | #71 | Exceptional 15.3% |
| Immigrants | Sweden | 98.8 /100 | #72 | Exceptional 15.3% |
| Immigrants | Ukraine | 98.7 /100 | #73 | Exceptional 15.3% |
| Argentineans | 98.5 /100 | #74 | Exceptional 15.4% |
| Immigrants | Argentina | 98.5 /100 | #75 | Exceptional 15.4% |
| Croatians | 98.5 /100 | #76 | Exceptional 15.4% |
| Immigrants | Turkey | 98.3 /100 | #77 | Exceptional 15.4% |
| Sri Lankans | 98.1 /100 | #78 | Exceptional 15.5% |
| Australians | 98.0 /100 | #79 | Exceptional 15.5% |
Demographics Similar to Bermudans by Child Poverty Under the Age of 5
In terms of child poverty under the age of 5, the demographic groups most similar to Bermudans are Ecuadorian (19.2%, a difference of 0.050%), Ghanaian (19.2%, a difference of 0.090%), Immigrants from Sudan (19.2%, a difference of 0.17%), Cape Verdean (19.1%, a difference of 0.48%), and Trinidadian and Tobagonian (19.3%, a difference of 0.56%).
| Demographics | Rating | Rank | Child Poverty Under the Age of 5 |
| Nicaraguans | 1.6 /100 | #224 | Tragic 19.1% |
| Nigerians | 1.6 /100 | #225 | Tragic 19.1% |
| Immigrants | Eritrea | 1.5 /100 | #226 | Tragic 19.1% |
| Cape Verdeans | 1.4 /100 | #227 | Tragic 19.1% |
| Immigrants | Sudan | 1.3 /100 | #228 | Tragic 19.2% |
| Ghanaians | 1.2 /100 | #229 | Tragic 19.2% |
| Ecuadorians | 1.2 /100 | #230 | Tragic 19.2% |
| Bermudans | 1.2 /100 | #231 | Tragic 19.2% |
| Trinidadians and Tobagonians | 0.9 /100 | #232 | Tragic 19.3% |
| Sudanese | 0.9 /100 | #233 | Tragic 19.3% |
| Immigrants | Micronesia | 0.9 /100 | #234 | Tragic 19.4% |
| Immigrants | Laos | 0.8 /100 | #235 | Tragic 19.4% |
| Immigrants | Trinidad and Tobago | 0.8 /100 | #236 | Tragic 19.4% |
| Immigrants | Cabo Verde | 0.6 /100 | #237 | Tragic 19.5% |
| Salvadorans | 0.6 /100 | #238 | Tragic 19.5% |