Czech vs Bermudan Child Poverty Under the Age of 5
COMPARE
Czech
Bermudan
Child Poverty Under the Age of 5
Child Poverty Under the Age of 5 Comparison
Czechs
Bermudans
15.5%
CHILD POVERTY UNDER THE AGE OF 5
97.8/ 100
METRIC RATING
81st/ 347
METRIC RANK
19.2%
CHILD POVERTY UNDER THE AGE OF 5
1.2/ 100
METRIC RATING
231st/ 347
METRIC RANK
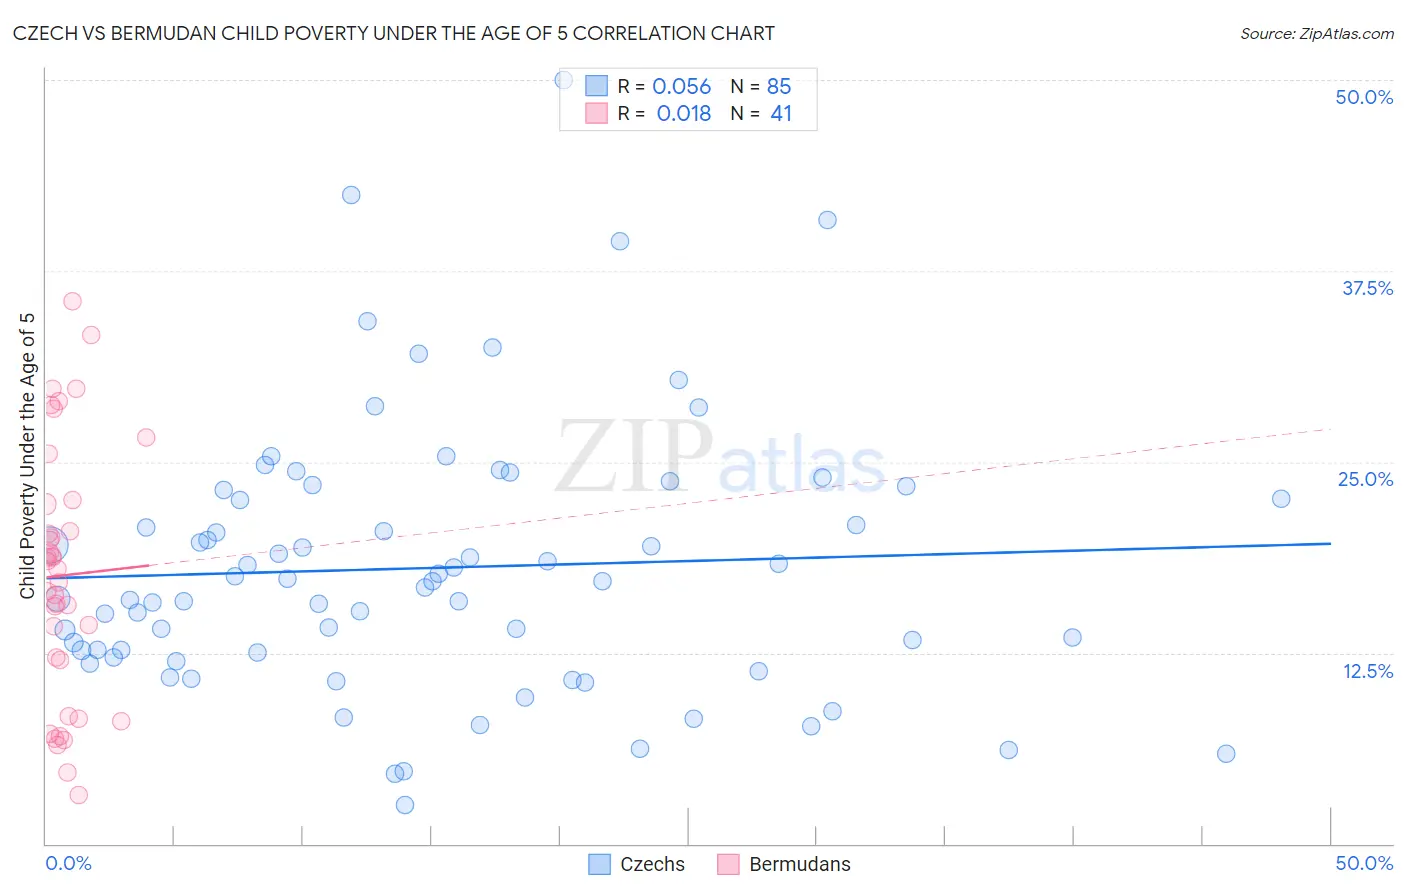
Czech vs Bermudan Child Poverty Under the Age of 5 Correlation Chart
The statistical analysis conducted on geographies consisting of 456,271,620 people shows a slight positive correlation between the proportion of Czechs and poverty level among children under the age of 5 in the United States with a correlation coefficient (R) of 0.056 and weighted average of 15.5%. Similarly, the statistical analysis conducted on geographies consisting of 55,495,700 people shows no correlation between the proportion of Bermudans and poverty level among children under the age of 5 in the United States with a correlation coefficient (R) of 0.018 and weighted average of 19.2%, a difference of 23.7%.
Child Poverty Under the Age of 5 Correlation Summary
| Measurement | Czech | Bermudan |
| Minimum | 2.6% | 3.2% |
| Maximum | 50.0% | 35.5% |
| Range | 47.4% | 32.4% |
| Mean | 18.1% | 17.6% |
| Median | 17.2% | 18.0% |
| Interquartile 25% (IQ1) | 12.3% | 10.2% |
| Interquartile 75% (IQ3) | 22.9% | 22.4% |
| Interquartile Range (IQR) | 10.5% | 12.2% |
| Standard Deviation (Sample) | 8.8% | 8.3% |
| Standard Deviation (Population) | 8.7% | 8.2% |
Similar Demographics by Child Poverty Under the Age of 5
Demographics Similar to Czechs by Child Poverty Under the Age of 5
In terms of child poverty under the age of 5, the demographic groups most similar to Czechs are Italian (15.5%, a difference of 0.11%), Immigrants from Italy (15.6%, a difference of 0.14%), Australian (15.5%, a difference of 0.23%), Chilean (15.6%, a difference of 0.30%), and Immigrants from Netherlands (15.6%, a difference of 0.32%).
| Demographics | Rating | Rank | Child Poverty Under the Age of 5 |
| Argentineans | 98.5 /100 | #74 | Exceptional 15.4% |
| Immigrants | Argentina | 98.5 /100 | #75 | Exceptional 15.4% |
| Croatians | 98.5 /100 | #76 | Exceptional 15.4% |
| Immigrants | Turkey | 98.3 /100 | #77 | Exceptional 15.4% |
| Sri Lankans | 98.1 /100 | #78 | Exceptional 15.5% |
| Australians | 98.0 /100 | #79 | Exceptional 15.5% |
| Italians | 97.9 /100 | #80 | Exceptional 15.5% |
| Czechs | 97.8 /100 | #81 | Exceptional 15.5% |
| Immigrants | Italy | 97.7 /100 | #82 | Exceptional 15.6% |
| Chileans | 97.6 /100 | #83 | Exceptional 15.6% |
| Immigrants | Netherlands | 97.6 /100 | #84 | Exceptional 15.6% |
| Immigrants | Latvia | 97.4 /100 | #85 | Exceptional 15.6% |
| Immigrants | Malaysia | 97.4 /100 | #86 | Exceptional 15.6% |
| Immigrants | Vietnam | 97.4 /100 | #87 | Exceptional 15.6% |
| Jordanians | 97.3 /100 | #88 | Exceptional 15.6% |
Demographics Similar to Bermudans by Child Poverty Under the Age of 5
In terms of child poverty under the age of 5, the demographic groups most similar to Bermudans are Ecuadorian (19.2%, a difference of 0.050%), Ghanaian (19.2%, a difference of 0.090%), Immigrants from Sudan (19.2%, a difference of 0.17%), Cape Verdean (19.1%, a difference of 0.48%), and Trinidadian and Tobagonian (19.3%, a difference of 0.56%).
| Demographics | Rating | Rank | Child Poverty Under the Age of 5 |
| Nicaraguans | 1.6 /100 | #224 | Tragic 19.1% |
| Nigerians | 1.6 /100 | #225 | Tragic 19.1% |
| Immigrants | Eritrea | 1.5 /100 | #226 | Tragic 19.1% |
| Cape Verdeans | 1.4 /100 | #227 | Tragic 19.1% |
| Immigrants | Sudan | 1.3 /100 | #228 | Tragic 19.2% |
| Ghanaians | 1.2 /100 | #229 | Tragic 19.2% |
| Ecuadorians | 1.2 /100 | #230 | Tragic 19.2% |
| Bermudans | 1.2 /100 | #231 | Tragic 19.2% |
| Trinidadians and Tobagonians | 0.9 /100 | #232 | Tragic 19.3% |
| Sudanese | 0.9 /100 | #233 | Tragic 19.3% |
| Immigrants | Micronesia | 0.9 /100 | #234 | Tragic 19.4% |
| Immigrants | Laos | 0.8 /100 | #235 | Tragic 19.4% |
| Immigrants | Trinidad and Tobago | 0.8 /100 | #236 | Tragic 19.4% |
| Immigrants | Cabo Verde | 0.6 /100 | #237 | Tragic 19.5% |
| Salvadorans | 0.6 /100 | #238 | Tragic 19.5% |