Immigrants from Argentina vs Yugoslavian Child Poverty Under the Age of 5
COMPARE
Immigrants from Argentina
Yugoslavian
Child Poverty Under the Age of 5
Child Poverty Under the Age of 5 Comparison
Immigrants from Argentina
Yugoslavians
15.4%
CHILD POVERTY UNDER THE AGE OF 5
98.5/ 100
METRIC RATING
75th/ 347
METRIC RANK
17.2%
CHILD POVERTY UNDER THE AGE OF 5
54.1/ 100
METRIC RATING
172nd/ 347
METRIC RANK
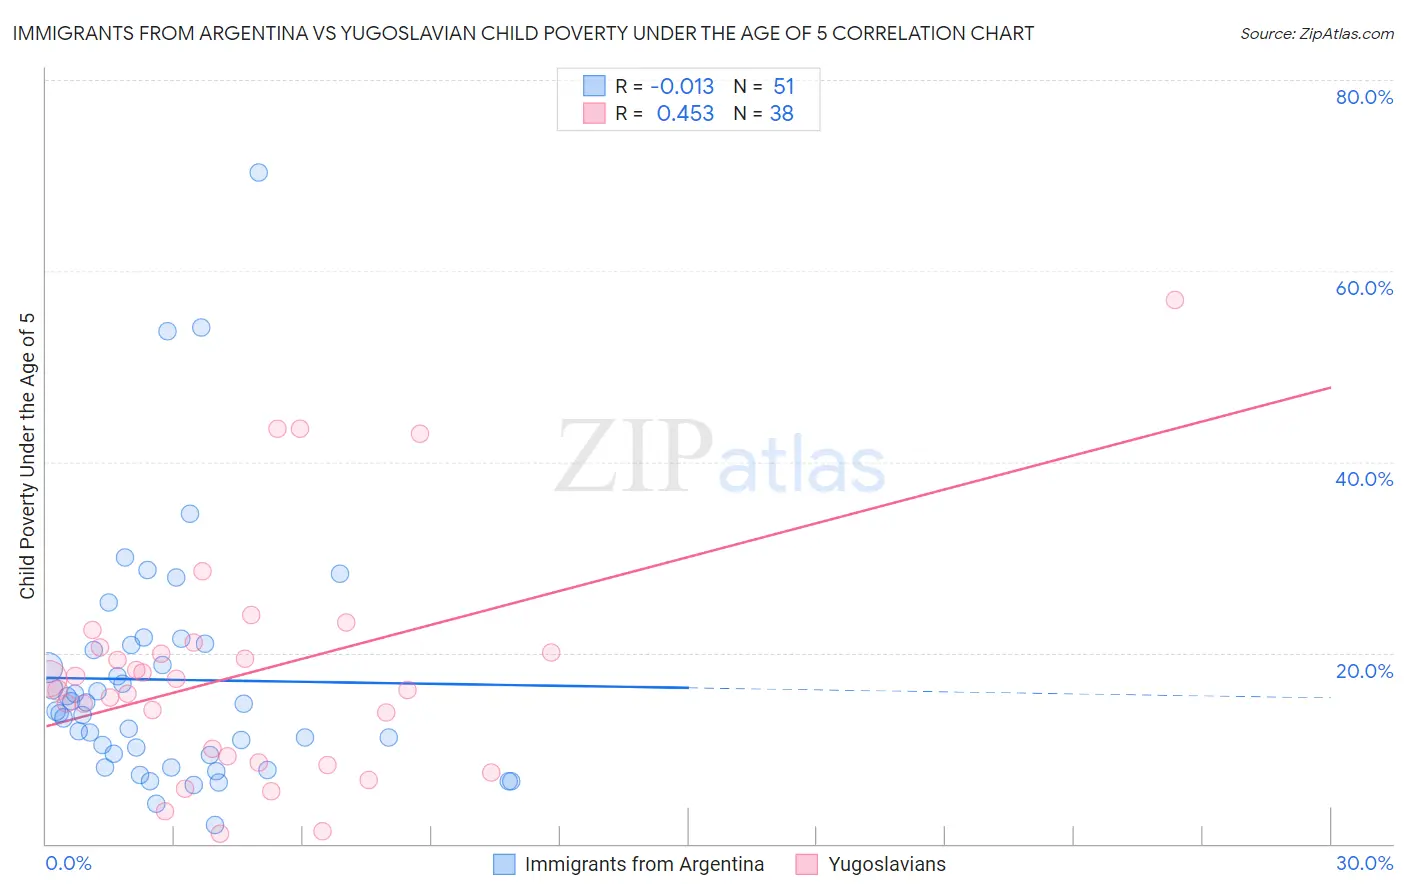
Immigrants from Argentina vs Yugoslavian Child Poverty Under the Age of 5 Correlation Chart
The statistical analysis conducted on geographies consisting of 256,145,971 people shows no correlation between the proportion of Immigrants from Argentina and poverty level among children under the age of 5 in the United States with a correlation coefficient (R) of -0.013 and weighted average of 15.4%. Similarly, the statistical analysis conducted on geographies consisting of 276,797,042 people shows a moderate positive correlation between the proportion of Yugoslavians and poverty level among children under the age of 5 in the United States with a correlation coefficient (R) of 0.453 and weighted average of 17.2%, a difference of 11.6%.
Child Poverty Under the Age of 5 Correlation Summary
| Measurement | Immigrants from Argentina | Yugoslavian |
| Minimum | 2.0% | 1.0% |
| Maximum | 70.4% | 57.0% |
| Range | 68.4% | 56.0% |
| Mean | 17.2% | 17.9% |
| Median | 13.9% | 16.7% |
| Interquartile 25% (IQ1) | 9.3% | 9.1% |
| Interquartile 75% (IQ3) | 20.8% | 20.5% |
| Interquartile Range (IQR) | 11.5% | 11.4% |
| Standard Deviation (Sample) | 13.0% | 12.1% |
| Standard Deviation (Population) | 12.9% | 11.9% |
Similar Demographics by Child Poverty Under the Age of 5
Demographics Similar to Immigrants from Argentina by Child Poverty Under the Age of 5
In terms of child poverty under the age of 5, the demographic groups most similar to Immigrants from Argentina are Croatian (15.4%, a difference of 0.0%), Argentinean (15.4%, a difference of 0.15%), Immigrants from Turkey (15.4%, a difference of 0.21%), Immigrants from Ukraine (15.3%, a difference of 0.51%), and Sri Lankan (15.5%, a difference of 0.54%).
| Demographics | Rating | Rank | Child Poverty Under the Age of 5 |
| Zimbabweans | 99.0 /100 | #68 | Exceptional 15.2% |
| Lithuanians | 99.0 /100 | #69 | Exceptional 15.2% |
| Immigrants | Belgium | 98.8 /100 | #70 | Exceptional 15.3% |
| Immigrants | Egypt | 98.8 /100 | #71 | Exceptional 15.3% |
| Immigrants | Sweden | 98.8 /100 | #72 | Exceptional 15.3% |
| Immigrants | Ukraine | 98.7 /100 | #73 | Exceptional 15.3% |
| Argentineans | 98.5 /100 | #74 | Exceptional 15.4% |
| Immigrants | Argentina | 98.5 /100 | #75 | Exceptional 15.4% |
| Croatians | 98.5 /100 | #76 | Exceptional 15.4% |
| Immigrants | Turkey | 98.3 /100 | #77 | Exceptional 15.4% |
| Sri Lankans | 98.1 /100 | #78 | Exceptional 15.5% |
| Australians | 98.0 /100 | #79 | Exceptional 15.5% |
| Italians | 97.9 /100 | #80 | Exceptional 15.5% |
| Czechs | 97.8 /100 | #81 | Exceptional 15.5% |
| Immigrants | Italy | 97.7 /100 | #82 | Exceptional 15.6% |
Demographics Similar to Yugoslavians by Child Poverty Under the Age of 5
In terms of child poverty under the age of 5, the demographic groups most similar to Yugoslavians are Welsh (17.2%, a difference of 0.010%), Immigrants from Saudi Arabia (17.2%, a difference of 0.43%), Immigrants from Morocco (17.1%, a difference of 0.51%), Immigrants from Western Asia (17.1%, a difference of 0.54%), and Immigrants from South America (17.1%, a difference of 0.63%).
| Demographics | Rating | Rank | Child Poverty Under the Age of 5 |
| Immigrants | Colombia | 66.9 /100 | #165 | Good 16.9% |
| Slavs | 64.0 /100 | #166 | Good 17.0% |
| Immigrants | Uzbekistan | 62.0 /100 | #167 | Good 17.0% |
| Uruguayans | 60.5 /100 | #168 | Good 17.0% |
| Immigrants | South America | 60.0 /100 | #169 | Good 17.1% |
| Immigrants | Western Asia | 59.2 /100 | #170 | Average 17.1% |
| Immigrants | Morocco | 58.9 /100 | #171 | Average 17.1% |
| Yugoslavians | 54.1 /100 | #172 | Average 17.2% |
| Welsh | 54.0 /100 | #173 | Average 17.2% |
| Immigrants | Saudi Arabia | 50.0 /100 | #174 | Average 17.2% |
| Immigrants | Lebanon | 47.6 /100 | #175 | Average 17.3% |
| Immigrants | Iraq | 45.2 /100 | #176 | Average 17.3% |
| Immigrants | Sierra Leone | 43.6 /100 | #177 | Average 17.3% |
| Immigrants | Cameroon | 42.7 /100 | #178 | Average 17.4% |
| Hawaiians | 41.5 /100 | #179 | Average 17.4% |