Immigrants from Argentina vs Immigrants from South Central Asia Child Poverty Under the Age of 5
COMPARE
Immigrants from Argentina
Immigrants from South Central Asia
Child Poverty Under the Age of 5
Child Poverty Under the Age of 5 Comparison
Immigrants from Argentina
Immigrants from South Central Asia
15.4%
CHILD POVERTY UNDER THE AGE OF 5
98.5/ 100
METRIC RATING
75th/ 347
METRIC RANK
13.3%
CHILD POVERTY UNDER THE AGE OF 5
100.0/ 100
METRIC RATING
12th/ 347
METRIC RANK
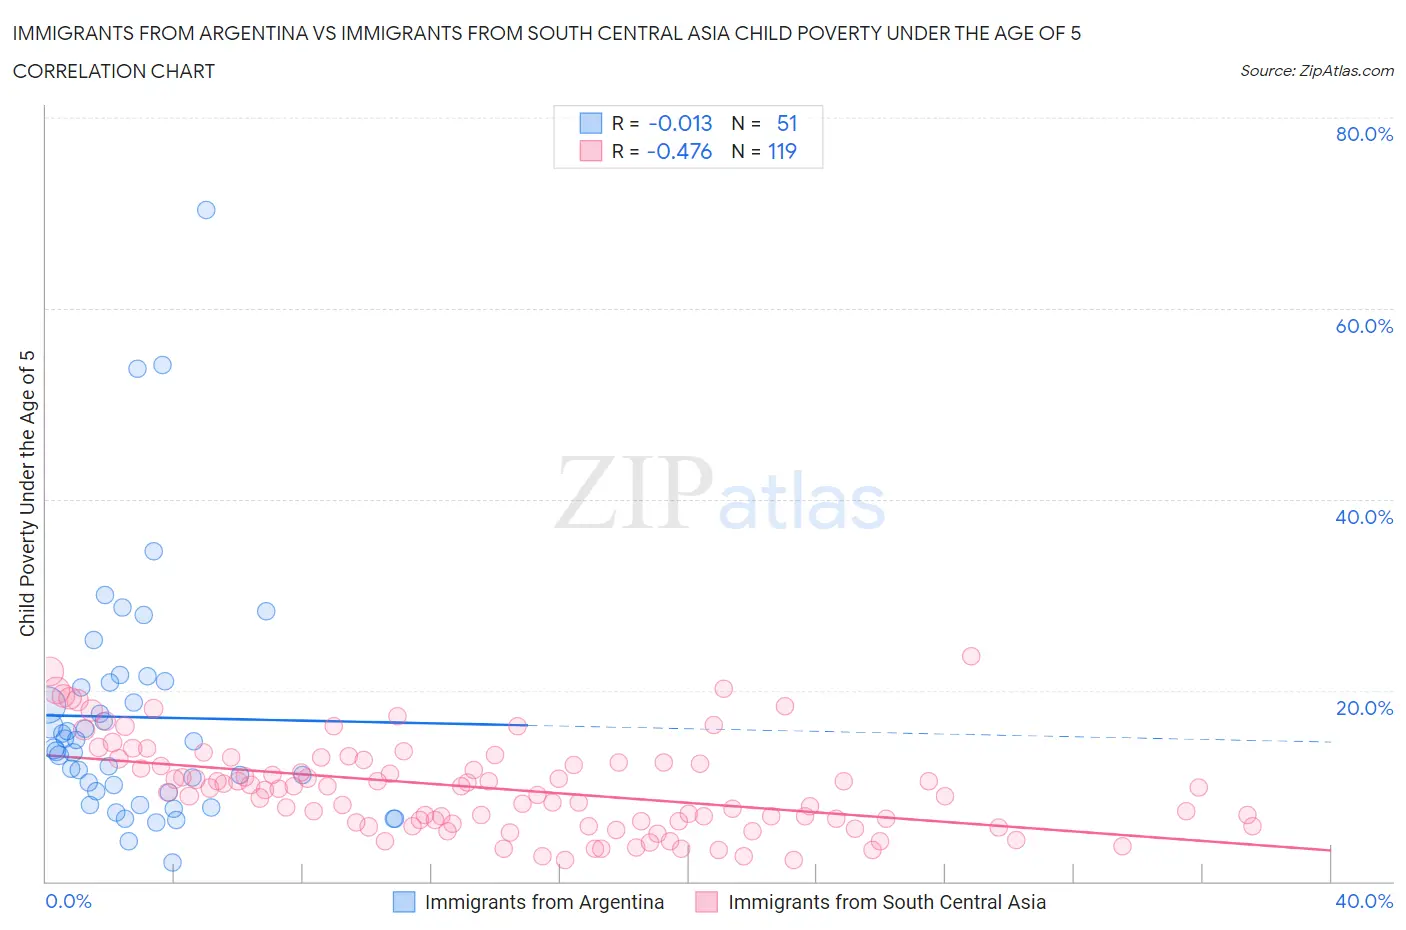
Immigrants from Argentina vs Immigrants from South Central Asia Child Poverty Under the Age of 5 Correlation Chart
The statistical analysis conducted on geographies consisting of 256,145,971 people shows no correlation between the proportion of Immigrants from Argentina and poverty level among children under the age of 5 in the United States with a correlation coefficient (R) of -0.013 and weighted average of 15.4%. Similarly, the statistical analysis conducted on geographies consisting of 448,638,290 people shows a moderate negative correlation between the proportion of Immigrants from South Central Asia and poverty level among children under the age of 5 in the United States with a correlation coefficient (R) of -0.476 and weighted average of 13.3%, a difference of 16.0%.
Child Poverty Under the Age of 5 Correlation Summary
| Measurement | Immigrants from Argentina | Immigrants from South Central Asia |
| Minimum | 2.0% | 2.2% |
| Maximum | 70.4% | 23.5% |
| Range | 68.4% | 21.3% |
| Mean | 17.2% | 9.7% |
| Median | 13.9% | 9.7% |
| Interquartile 25% (IQ1) | 9.3% | 6.2% |
| Interquartile 75% (IQ3) | 20.8% | 12.5% |
| Interquartile Range (IQR) | 11.5% | 6.3% |
| Standard Deviation (Sample) | 13.0% | 4.7% |
| Standard Deviation (Population) | 12.9% | 4.7% |
Similar Demographics by Child Poverty Under the Age of 5
Demographics Similar to Immigrants from Argentina by Child Poverty Under the Age of 5
In terms of child poverty under the age of 5, the demographic groups most similar to Immigrants from Argentina are Croatian (15.4%, a difference of 0.0%), Argentinean (15.4%, a difference of 0.15%), Immigrants from Turkey (15.4%, a difference of 0.21%), Immigrants from Ukraine (15.3%, a difference of 0.51%), and Sri Lankan (15.5%, a difference of 0.54%).
| Demographics | Rating | Rank | Child Poverty Under the Age of 5 |
| Zimbabweans | 99.0 /100 | #68 | Exceptional 15.2% |
| Lithuanians | 99.0 /100 | #69 | Exceptional 15.2% |
| Immigrants | Belgium | 98.8 /100 | #70 | Exceptional 15.3% |
| Immigrants | Egypt | 98.8 /100 | #71 | Exceptional 15.3% |
| Immigrants | Sweden | 98.8 /100 | #72 | Exceptional 15.3% |
| Immigrants | Ukraine | 98.7 /100 | #73 | Exceptional 15.3% |
| Argentineans | 98.5 /100 | #74 | Exceptional 15.4% |
| Immigrants | Argentina | 98.5 /100 | #75 | Exceptional 15.4% |
| Croatians | 98.5 /100 | #76 | Exceptional 15.4% |
| Immigrants | Turkey | 98.3 /100 | #77 | Exceptional 15.4% |
| Sri Lankans | 98.1 /100 | #78 | Exceptional 15.5% |
| Australians | 98.0 /100 | #79 | Exceptional 15.5% |
| Italians | 97.9 /100 | #80 | Exceptional 15.5% |
| Czechs | 97.8 /100 | #81 | Exceptional 15.5% |
| Immigrants | Italy | 97.7 /100 | #82 | Exceptional 15.6% |
Demographics Similar to Immigrants from South Central Asia by Child Poverty Under the Age of 5
In terms of child poverty under the age of 5, the demographic groups most similar to Immigrants from South Central Asia are Immigrants from Korea (13.2%, a difference of 0.10%), Burmese (13.2%, a difference of 0.21%), Bhutanese (13.4%, a difference of 0.75%), Immigrants from Iran (13.1%, a difference of 1.3%), and Okinawan (13.4%, a difference of 1.4%).
| Demographics | Rating | Rank | Child Poverty Under the Age of 5 |
| Immigrants | Hong Kong | 100.0 /100 | #5 | Exceptional 12.4% |
| Immigrants | Singapore | 100.0 /100 | #6 | Exceptional 12.9% |
| Chinese | 100.0 /100 | #7 | Exceptional 13.1% |
| Iranians | 100.0 /100 | #8 | Exceptional 13.1% |
| Immigrants | Iran | 100.0 /100 | #9 | Exceptional 13.1% |
| Burmese | 100.0 /100 | #10 | Exceptional 13.2% |
| Immigrants | Korea | 100.0 /100 | #11 | Exceptional 13.2% |
| Immigrants | South Central Asia | 100.0 /100 | #12 | Exceptional 13.3% |
| Bhutanese | 100.0 /100 | #13 | Exceptional 13.4% |
| Okinawans | 100.0 /100 | #14 | Exceptional 13.4% |
| Indians (Asian) | 100.0 /100 | #15 | Exceptional 13.4% |
| Immigrants | Eastern Asia | 100.0 /100 | #16 | Exceptional 13.5% |
| Assyrians/Chaldeans/Syriacs | 100.0 /100 | #17 | Exceptional 13.6% |
| Immigrants | China | 100.0 /100 | #18 | Exceptional 13.6% |
| Immigrants | Ireland | 100.0 /100 | #19 | Exceptional 13.7% |