Immigrants from Argentina vs Danish Child Poverty Under the Age of 5
COMPARE
Immigrants from Argentina
Danish
Child Poverty Under the Age of 5
Child Poverty Under the Age of 5 Comparison
Immigrants from Argentina
Danes
15.4%
CHILD POVERTY UNDER THE AGE OF 5
98.5/ 100
METRIC RATING
75th/ 347
METRIC RANK
14.9%
CHILD POVERTY UNDER THE AGE OF 5
99.4/ 100
METRIC RATING
55th/ 347
METRIC RANK
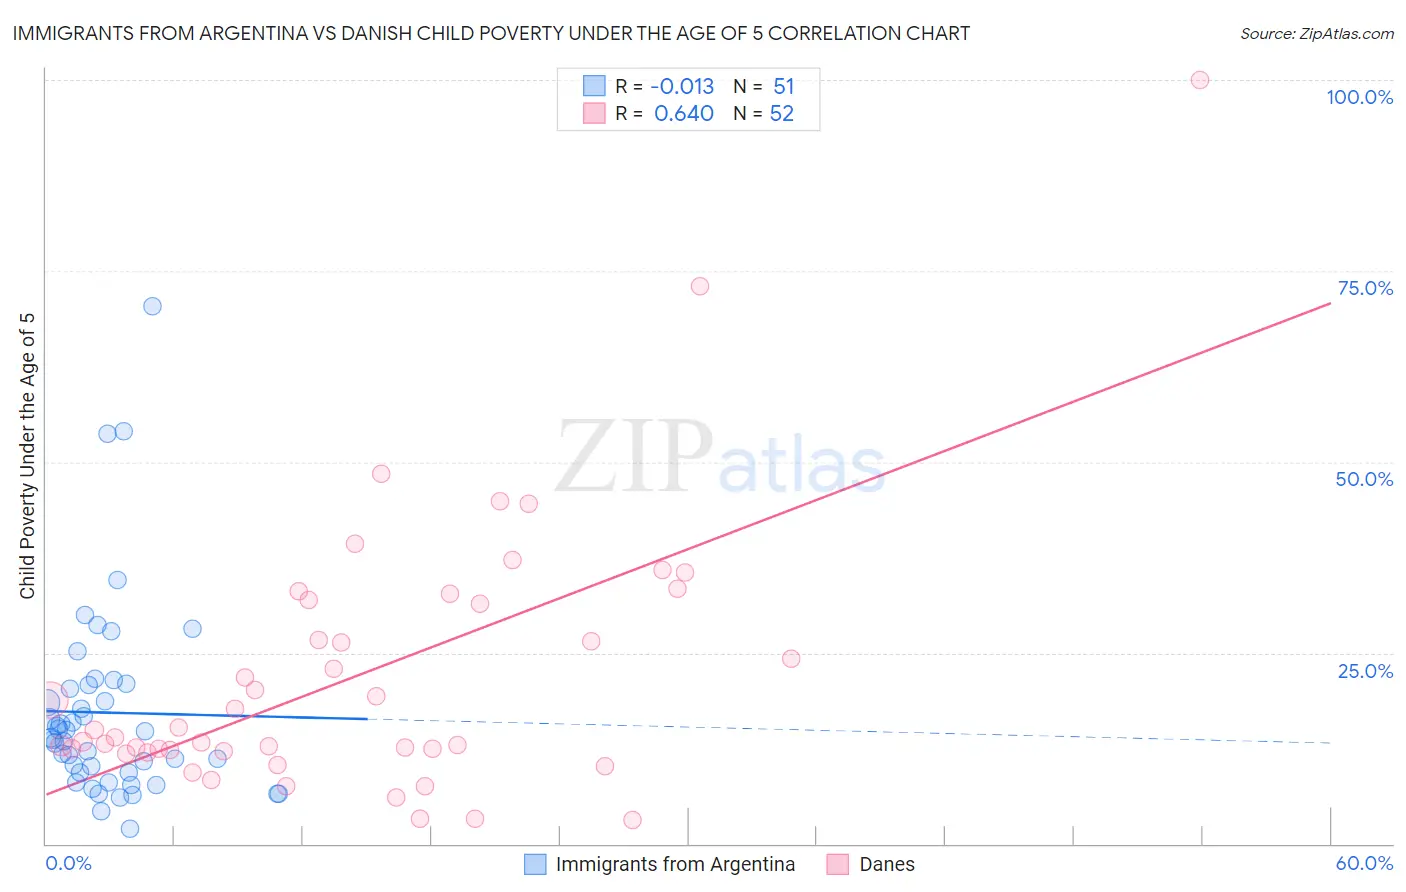
Immigrants from Argentina vs Danish Child Poverty Under the Age of 5 Correlation Chart
The statistical analysis conducted on geographies consisting of 256,145,971 people shows no correlation between the proportion of Immigrants from Argentina and poverty level among children under the age of 5 in the United States with a correlation coefficient (R) of -0.013 and weighted average of 15.4%. Similarly, the statistical analysis conducted on geographies consisting of 447,094,806 people shows a significant positive correlation between the proportion of Danes and poverty level among children under the age of 5 in the United States with a correlation coefficient (R) of 0.640 and weighted average of 14.9%, a difference of 3.0%.
Child Poverty Under the Age of 5 Correlation Summary
| Measurement | Immigrants from Argentina | Danish |
| Minimum | 2.0% | 3.2% |
| Maximum | 70.4% | 100.0% |
| Range | 68.4% | 96.8% |
| Mean | 17.2% | 22.1% |
| Median | 13.9% | 14.4% |
| Interquartile 25% (IQ1) | 9.3% | 12.2% |
| Interquartile 75% (IQ3) | 20.8% | 31.7% |
| Interquartile Range (IQR) | 11.5% | 19.5% |
| Standard Deviation (Sample) | 13.0% | 17.6% |
| Standard Deviation (Population) | 12.9% | 17.5% |
Demographics Similar to Immigrants from Argentina and Danes by Child Poverty Under the Age of 5
In terms of child poverty under the age of 5, the demographic groups most similar to Immigrants from Argentina are Argentinean (15.4%, a difference of 0.15%), Immigrants from Ukraine (15.3%, a difference of 0.51%), Immigrants from Sweden (15.3%, a difference of 0.74%), Immigrants from Belgium (15.3%, a difference of 0.81%), and Immigrants from Egypt (15.3%, a difference of 0.81%). Similarly, the demographic groups most similar to Danes are Immigrants from Pakistan (14.9%, a difference of 0.070%), Egyptian (14.9%, a difference of 0.15%), Swedish (15.0%, a difference of 0.20%), Paraguayan (15.0%, a difference of 0.35%), and Immigrants from Russia (15.0%, a difference of 0.44%).
| Demographics | Rating | Rank | Child Poverty Under the Age of 5 |
| Danes | 99.4 /100 | #55 | Exceptional 14.9% |
| Immigrants | Pakistan | 99.4 /100 | #56 | Exceptional 14.9% |
| Egyptians | 99.4 /100 | #57 | Exceptional 14.9% |
| Swedes | 99.4 /100 | #58 | Exceptional 15.0% |
| Paraguayans | 99.4 /100 | #59 | Exceptional 15.0% |
| Immigrants | Russia | 99.3 /100 | #60 | Exceptional 15.0% |
| Immigrants | Poland | 99.1 /100 | #61 | Exceptional 15.1% |
| Immigrants | Eastern Europe | 99.1 /100 | #62 | Exceptional 15.1% |
| Immigrants | Europe | 99.1 /100 | #63 | Exceptional 15.1% |
| Immigrants | Romania | 99.1 /100 | #64 | Exceptional 15.2% |
| Immigrants | Fiji | 99.0 /100 | #65 | Exceptional 15.2% |
| Immigrants | Scotland | 99.0 /100 | #66 | Exceptional 15.2% |
| Greeks | 99.0 /100 | #67 | Exceptional 15.2% |
| Zimbabweans | 99.0 /100 | #68 | Exceptional 15.2% |
| Lithuanians | 99.0 /100 | #69 | Exceptional 15.2% |
| Immigrants | Belgium | 98.8 /100 | #70 | Exceptional 15.3% |
| Immigrants | Egypt | 98.8 /100 | #71 | Exceptional 15.3% |
| Immigrants | Sweden | 98.8 /100 | #72 | Exceptional 15.3% |
| Immigrants | Ukraine | 98.7 /100 | #73 | Exceptional 15.3% |
| Argentineans | 98.5 /100 | #74 | Exceptional 15.4% |
| Immigrants | Argentina | 98.5 /100 | #75 | Exceptional 15.4% |