Immigrants from Argentina vs Immigrants from Vietnam Child Poverty Under the Age of 5
COMPARE
Immigrants from Argentina
Immigrants from Vietnam
Child Poverty Under the Age of 5
Child Poverty Under the Age of 5 Comparison
Immigrants from Argentina
Immigrants from Vietnam
15.4%
CHILD POVERTY UNDER THE AGE OF 5
98.5/ 100
METRIC RATING
75th/ 347
METRIC RANK
15.6%
CHILD POVERTY UNDER THE AGE OF 5
97.4/ 100
METRIC RATING
87th/ 347
METRIC RANK
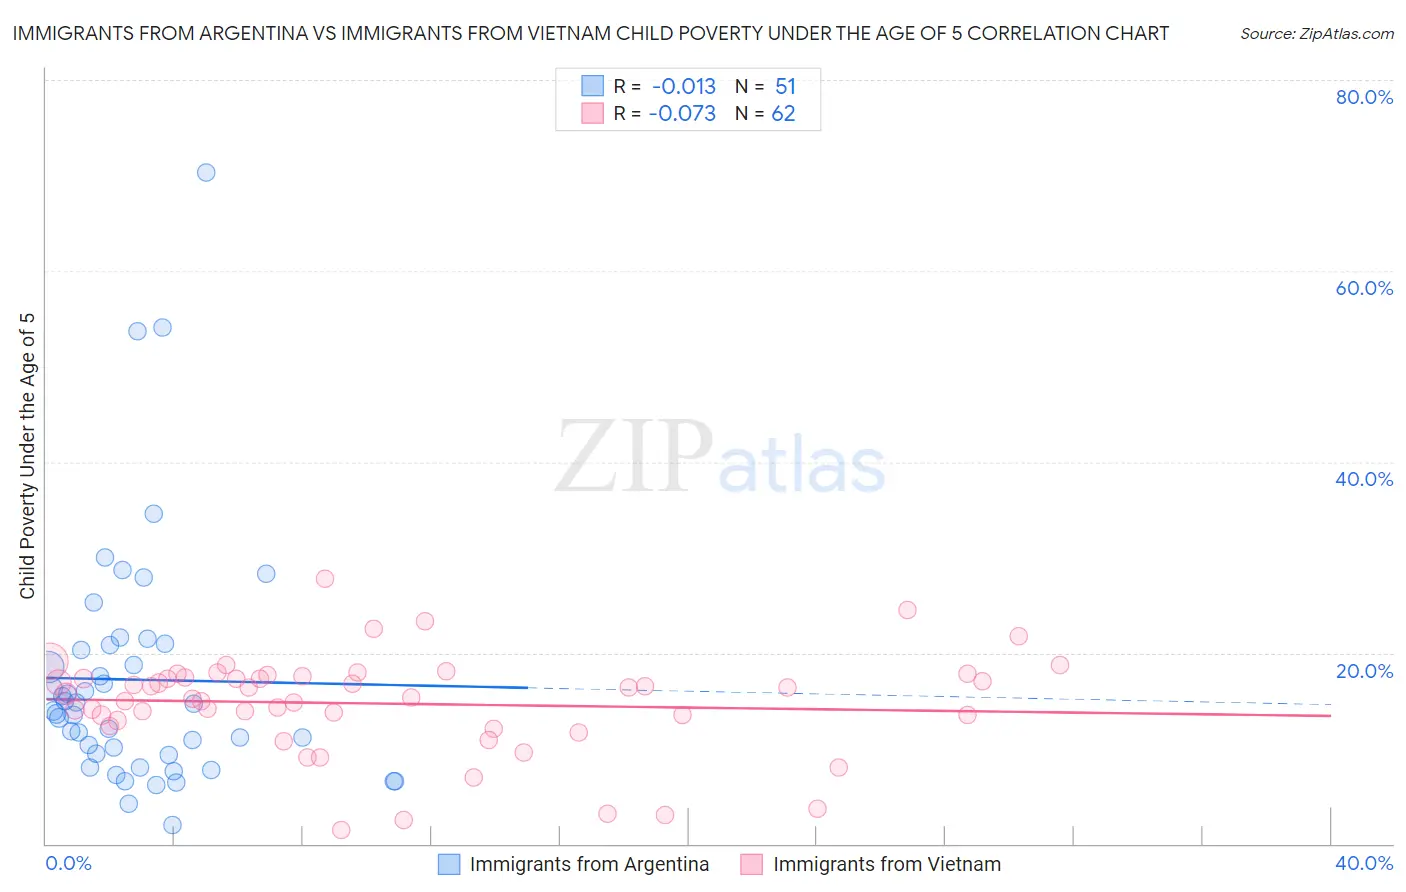
Immigrants from Argentina vs Immigrants from Vietnam Child Poverty Under the Age of 5 Correlation Chart
The statistical analysis conducted on geographies consisting of 256,145,971 people shows no correlation between the proportion of Immigrants from Argentina and poverty level among children under the age of 5 in the United States with a correlation coefficient (R) of -0.013 and weighted average of 15.4%. Similarly, the statistical analysis conducted on geographies consisting of 389,811,968 people shows a slight negative correlation between the proportion of Immigrants from Vietnam and poverty level among children under the age of 5 in the United States with a correlation coefficient (R) of -0.073 and weighted average of 15.6%, a difference of 1.6%.
Child Poverty Under the Age of 5 Correlation Summary
| Measurement | Immigrants from Argentina | Immigrants from Vietnam |
| Minimum | 2.0% | 1.5% |
| Maximum | 70.4% | 27.8% |
| Range | 68.4% | 26.3% |
| Mean | 17.2% | 14.7% |
| Median | 13.9% | 15.5% |
| Interquartile 25% (IQ1) | 9.3% | 12.9% |
| Interquartile 75% (IQ3) | 20.8% | 17.5% |
| Interquartile Range (IQR) | 11.5% | 4.6% |
| Standard Deviation (Sample) | 13.0% | 5.2% |
| Standard Deviation (Population) | 12.9% | 5.1% |
Demographics Similar to Immigrants from Argentina and Immigrants from Vietnam by Child Poverty Under the Age of 5
In terms of child poverty under the age of 5, the demographic groups most similar to Immigrants from Argentina are Croatian (15.4%, a difference of 0.0%), Argentinean (15.4%, a difference of 0.15%), Immigrants from Turkey (15.4%, a difference of 0.21%), Immigrants from Ukraine (15.3%, a difference of 0.51%), and Sri Lankan (15.5%, a difference of 0.54%). Similarly, the demographic groups most similar to Immigrants from Vietnam are Jordanian (15.6%, a difference of 0.050%), Immigrants from Latvia (15.6%, a difference of 0.080%), Immigrants from Malaysia (15.6%, a difference of 0.080%), Immigrants from Croatia (15.6%, a difference of 0.12%), and Immigrants from France (15.6%, a difference of 0.12%).
| Demographics | Rating | Rank | Child Poverty Under the Age of 5 |
| Immigrants | Egypt | 98.8 /100 | #71 | Exceptional 15.3% |
| Immigrants | Sweden | 98.8 /100 | #72 | Exceptional 15.3% |
| Immigrants | Ukraine | 98.7 /100 | #73 | Exceptional 15.3% |
| Argentineans | 98.5 /100 | #74 | Exceptional 15.4% |
| Immigrants | Argentina | 98.5 /100 | #75 | Exceptional 15.4% |
| Croatians | 98.5 /100 | #76 | Exceptional 15.4% |
| Immigrants | Turkey | 98.3 /100 | #77 | Exceptional 15.4% |
| Sri Lankans | 98.1 /100 | #78 | Exceptional 15.5% |
| Australians | 98.0 /100 | #79 | Exceptional 15.5% |
| Italians | 97.9 /100 | #80 | Exceptional 15.5% |
| Czechs | 97.8 /100 | #81 | Exceptional 15.5% |
| Immigrants | Italy | 97.7 /100 | #82 | Exceptional 15.6% |
| Chileans | 97.6 /100 | #83 | Exceptional 15.6% |
| Immigrants | Netherlands | 97.6 /100 | #84 | Exceptional 15.6% |
| Immigrants | Latvia | 97.4 /100 | #85 | Exceptional 15.6% |
| Immigrants | Malaysia | 97.4 /100 | #86 | Exceptional 15.6% |
| Immigrants | Vietnam | 97.4 /100 | #87 | Exceptional 15.6% |
| Jordanians | 97.3 /100 | #88 | Exceptional 15.6% |
| Immigrants | Croatia | 97.3 /100 | #89 | Exceptional 15.6% |
| Immigrants | France | 97.3 /100 | #90 | Exceptional 15.6% |
| Poles | 97.2 /100 | #91 | Exceptional 15.7% |