Swedish vs Bermudan Child Poverty Under the Age of 5
COMPARE
Swedish
Bermudan
Child Poverty Under the Age of 5
Child Poverty Under the Age of 5 Comparison
Swedes
Bermudans
15.0%
CHILD POVERTY UNDER THE AGE OF 5
99.4/ 100
METRIC RATING
58th/ 347
METRIC RANK
19.2%
CHILD POVERTY UNDER THE AGE OF 5
1.2/ 100
METRIC RATING
231st/ 347
METRIC RANK
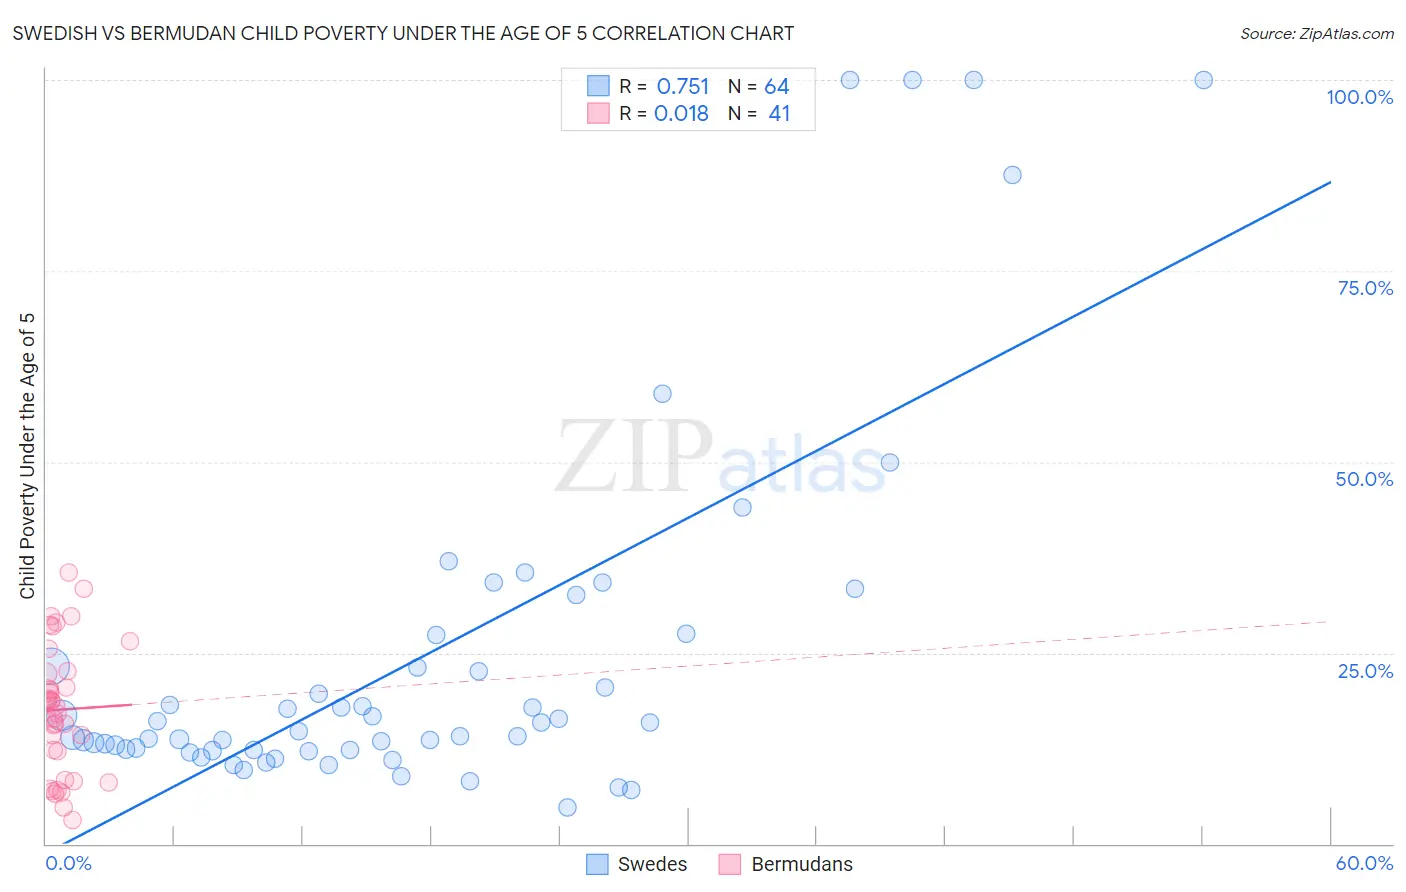
Swedish vs Bermudan Child Poverty Under the Age of 5 Correlation Chart
The statistical analysis conducted on geographies consisting of 502,877,472 people shows a strong positive correlation between the proportion of Swedes and poverty level among children under the age of 5 in the United States with a correlation coefficient (R) of 0.751 and weighted average of 15.0%. Similarly, the statistical analysis conducted on geographies consisting of 55,495,700 people shows no correlation between the proportion of Bermudans and poverty level among children under the age of 5 in the United States with a correlation coefficient (R) of 0.018 and weighted average of 19.2%, a difference of 28.5%.
Child Poverty Under the Age of 5 Correlation Summary
| Measurement | Swedish | Bermudan |
| Minimum | 4.8% | 3.2% |
| Maximum | 100.0% | 35.5% |
| Range | 95.2% | 32.4% |
| Mean | 24.6% | 17.6% |
| Median | 15.2% | 18.0% |
| Interquartile 25% (IQ1) | 12.3% | 10.2% |
| Interquartile 75% (IQ3) | 25.3% | 22.4% |
| Interquartile Range (IQR) | 13.0% | 12.2% |
| Standard Deviation (Sample) | 23.8% | 8.3% |
| Standard Deviation (Population) | 23.6% | 8.2% |
Similar Demographics by Child Poverty Under the Age of 5
Demographics Similar to Swedes by Child Poverty Under the Age of 5
In terms of child poverty under the age of 5, the demographic groups most similar to Swedes are Egyptian (14.9%, a difference of 0.050%), Immigrants from Pakistan (14.9%, a difference of 0.13%), Paraguayan (15.0%, a difference of 0.15%), Danish (14.9%, a difference of 0.20%), and Immigrants from Russia (15.0%, a difference of 0.24%).
| Demographics | Rating | Rank | Child Poverty Under the Age of 5 |
| Estonians | 99.6 /100 | #51 | Exceptional 14.8% |
| Immigrants | Serbia | 99.5 /100 | #52 | Exceptional 14.9% |
| Luxembourgers | 99.4 /100 | #53 | Exceptional 14.9% |
| Immigrants | Israel | 99.4 /100 | #54 | Exceptional 14.9% |
| Danes | 99.4 /100 | #55 | Exceptional 14.9% |
| Immigrants | Pakistan | 99.4 /100 | #56 | Exceptional 14.9% |
| Egyptians | 99.4 /100 | #57 | Exceptional 14.9% |
| Swedes | 99.4 /100 | #58 | Exceptional 15.0% |
| Paraguayans | 99.4 /100 | #59 | Exceptional 15.0% |
| Immigrants | Russia | 99.3 /100 | #60 | Exceptional 15.0% |
| Immigrants | Poland | 99.1 /100 | #61 | Exceptional 15.1% |
| Immigrants | Eastern Europe | 99.1 /100 | #62 | Exceptional 15.1% |
| Immigrants | Europe | 99.1 /100 | #63 | Exceptional 15.1% |
| Immigrants | Romania | 99.1 /100 | #64 | Exceptional 15.2% |
| Immigrants | Fiji | 99.0 /100 | #65 | Exceptional 15.2% |
Demographics Similar to Bermudans by Child Poverty Under the Age of 5
In terms of child poverty under the age of 5, the demographic groups most similar to Bermudans are Ecuadorian (19.2%, a difference of 0.050%), Ghanaian (19.2%, a difference of 0.090%), Immigrants from Sudan (19.2%, a difference of 0.17%), Cape Verdean (19.1%, a difference of 0.48%), and Trinidadian and Tobagonian (19.3%, a difference of 0.56%).
| Demographics | Rating | Rank | Child Poverty Under the Age of 5 |
| Nicaraguans | 1.6 /100 | #224 | Tragic 19.1% |
| Nigerians | 1.6 /100 | #225 | Tragic 19.1% |
| Immigrants | Eritrea | 1.5 /100 | #226 | Tragic 19.1% |
| Cape Verdeans | 1.4 /100 | #227 | Tragic 19.1% |
| Immigrants | Sudan | 1.3 /100 | #228 | Tragic 19.2% |
| Ghanaians | 1.2 /100 | #229 | Tragic 19.2% |
| Ecuadorians | 1.2 /100 | #230 | Tragic 19.2% |
| Bermudans | 1.2 /100 | #231 | Tragic 19.2% |
| Trinidadians and Tobagonians | 0.9 /100 | #232 | Tragic 19.3% |
| Sudanese | 0.9 /100 | #233 | Tragic 19.3% |
| Immigrants | Micronesia | 0.9 /100 | #234 | Tragic 19.4% |
| Immigrants | Laos | 0.8 /100 | #235 | Tragic 19.4% |
| Immigrants | Trinidad and Tobago | 0.8 /100 | #236 | Tragic 19.4% |
| Immigrants | Cabo Verde | 0.6 /100 | #237 | Tragic 19.5% |
| Salvadorans | 0.6 /100 | #238 | Tragic 19.5% |