Jamaican vs South American Male Poverty
COMPARE
Jamaican
South American
Male Poverty
Male Poverty Comparison
Jamaicans
South Americans
13.2%
MALE POVERTY
0.1/ 100
METRIC RATING
265th/ 347
METRIC RANK
11.1%
MALE POVERTY
53.8/ 100
METRIC RATING
170th/ 347
METRIC RANK
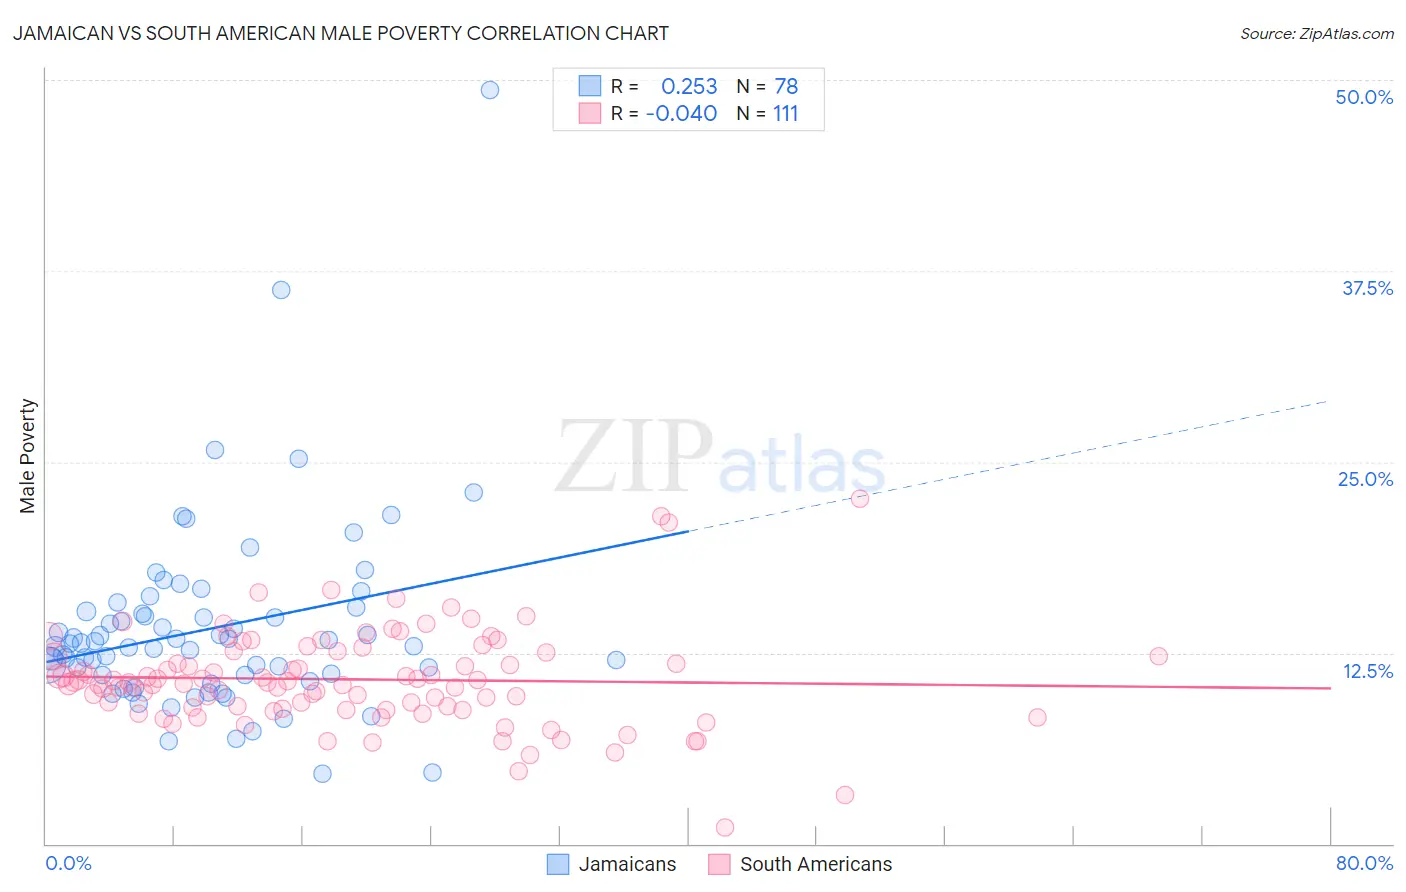
Jamaican vs South American Male Poverty Correlation Chart
The statistical analysis conducted on geographies consisting of 367,625,725 people shows a weak positive correlation between the proportion of Jamaicans and poverty level among males in the United States with a correlation coefficient (R) of 0.253 and weighted average of 13.2%. Similarly, the statistical analysis conducted on geographies consisting of 493,234,153 people shows no correlation between the proportion of South Americans and poverty level among males in the United States with a correlation coefficient (R) of -0.040 and weighted average of 11.1%, a difference of 18.6%.
Male Poverty Correlation Summary
| Measurement | Jamaican | South American |
| Minimum | 4.6% | 1.0% |
| Maximum | 49.4% | 22.6% |
| Range | 44.8% | 21.6% |
| Mean | 14.1% | 10.8% |
| Median | 13.0% | 10.6% |
| Interquartile 25% (IQ1) | 11.0% | 8.9% |
| Interquartile 75% (IQ3) | 15.2% | 12.5% |
| Interquartile Range (IQR) | 4.2% | 3.6% |
| Standard Deviation (Sample) | 6.3% | 3.2% |
| Standard Deviation (Population) | 6.3% | 3.2% |
Similar Demographics by Male Poverty
Demographics Similar to Jamaicans by Male Poverty
In terms of male poverty, the demographic groups most similar to Jamaicans are Iroquois (13.2%, a difference of 0.020%), Immigrants from Guyana (13.2%, a difference of 0.14%), Immigrants from Jamaica (13.3%, a difference of 0.26%), Subsaharan African (13.3%, a difference of 0.28%), and Central American (13.2%, a difference of 0.38%).
| Demographics | Rating | Rank | Male Poverty |
| Cape Verdeans | 0.1 /100 | #258 | Tragic 13.1% |
| Cherokee | 0.1 /100 | #259 | Tragic 13.1% |
| Ottawa | 0.1 /100 | #260 | Tragic 13.1% |
| Trinidadians and Tobagonians | 0.1 /100 | #261 | Tragic 13.1% |
| Spanish American Indians | 0.1 /100 | #262 | Tragic 13.1% |
| Central Americans | 0.1 /100 | #263 | Tragic 13.2% |
| Iroquois | 0.1 /100 | #264 | Tragic 13.2% |
| Jamaicans | 0.1 /100 | #265 | Tragic 13.2% |
| Immigrants | Guyana | 0.1 /100 | #266 | Tragic 13.2% |
| Immigrants | Jamaica | 0.1 /100 | #267 | Tragic 13.3% |
| Sub-Saharan Africans | 0.1 /100 | #268 | Tragic 13.3% |
| Guyanese | 0.0 /100 | #269 | Tragic 13.3% |
| Cree | 0.0 /100 | #270 | Tragic 13.3% |
| Spanish Americans | 0.0 /100 | #271 | Tragic 13.4% |
| Immigrants | Bahamas | 0.0 /100 | #272 | Tragic 13.5% |
Demographics Similar to South Americans by Male Poverty
In terms of male poverty, the demographic groups most similar to South Americans are Immigrants from Colombia (11.1%, a difference of 0.040%), Immigrants from Portugal (11.1%, a difference of 0.11%), Hungarian (11.1%, a difference of 0.14%), Immigrants from Albania (11.1%, a difference of 0.15%), and Immigrants from Spain (11.1%, a difference of 0.18%).
| Demographics | Rating | Rank | Male Poverty |
| Whites/Caucasians | 56.7 /100 | #163 | Average 11.1% |
| Ethiopians | 56.7 /100 | #164 | Average 11.1% |
| Immigrants | Spain | 55.5 /100 | #165 | Average 11.1% |
| Immigrants | Albania | 55.3 /100 | #166 | Average 11.1% |
| Hungarians | 55.1 /100 | #167 | Average 11.1% |
| Immigrants | Portugal | 54.9 /100 | #168 | Average 11.1% |
| Immigrants | Colombia | 54.2 /100 | #169 | Average 11.1% |
| South Americans | 53.8 /100 | #170 | Average 11.1% |
| Uruguayans | 51.0 /100 | #171 | Average 11.2% |
| Immigrants | Ethiopia | 50.7 /100 | #172 | Average 11.2% |
| Pennsylvania Germans | 50.5 /100 | #173 | Average 11.2% |
| Immigrants | Oceania | 50.0 /100 | #174 | Average 11.2% |
| Celtics | 47.5 /100 | #175 | Average 11.2% |
| Immigrants | Fiji | 46.0 /100 | #176 | Average 11.2% |
| Lebanese | 45.6 /100 | #177 | Average 11.2% |