Hispanic or Latino vs Salvadoran Male Poverty
COMPARE
Hispanic or Latino
Salvadoran
Male Poverty
Male Poverty Comparison
Hispanics or Latinos
Salvadorans
13.9%
MALE POVERTY
0.0/ 100
METRIC RATING
294th/ 347
METRIC RANK
12.6%
MALE POVERTY
0.6/ 100
METRIC RATING
231st/ 347
METRIC RANK
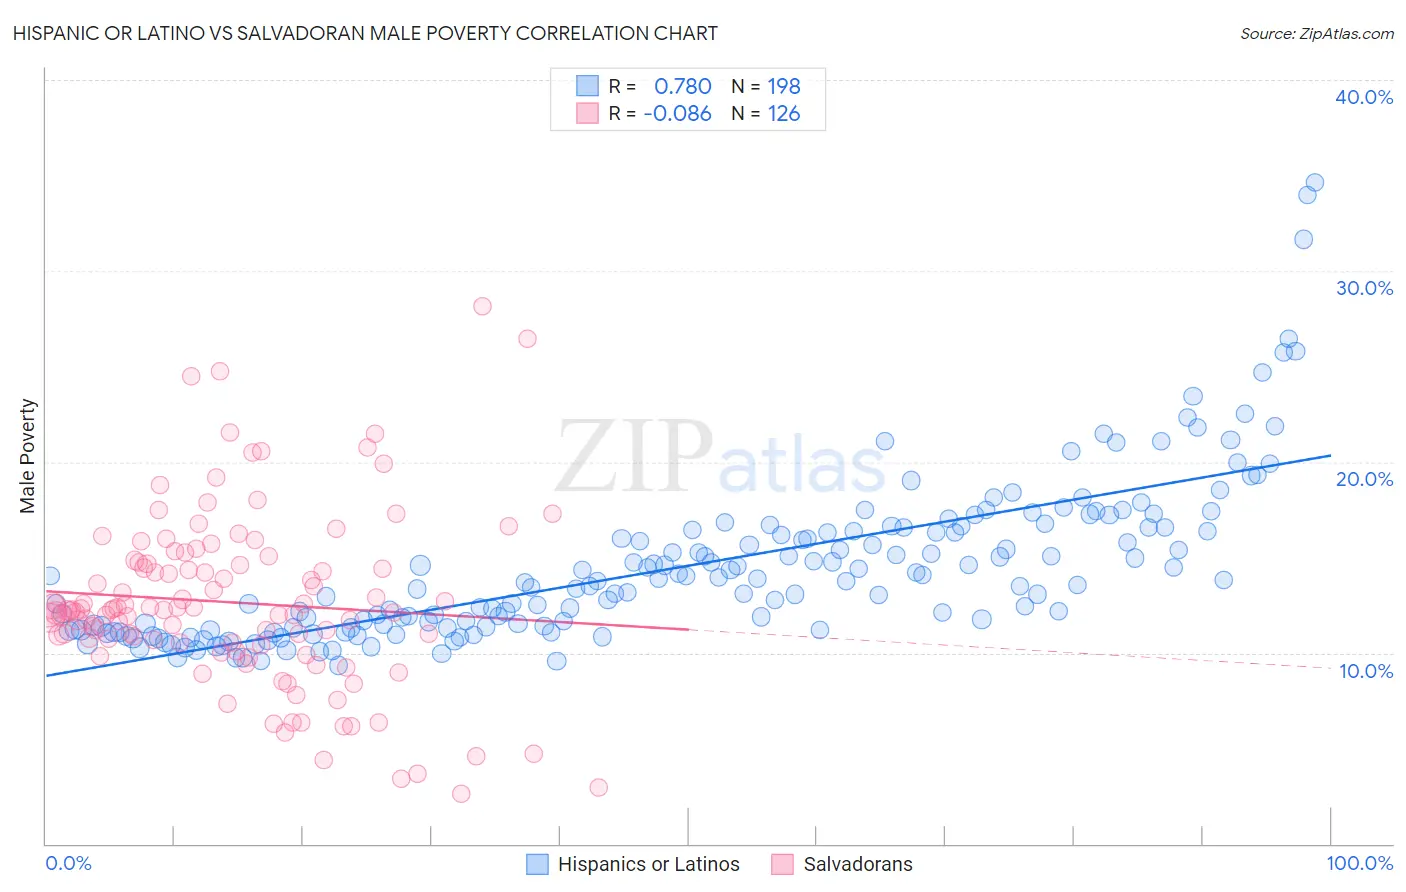
Hispanic or Latino vs Salvadoran Male Poverty Correlation Chart
The statistical analysis conducted on geographies consisting of 573,631,780 people shows a strong positive correlation between the proportion of Hispanics or Latinos and poverty level among males in the United States with a correlation coefficient (R) of 0.780 and weighted average of 13.9%. Similarly, the statistical analysis conducted on geographies consisting of 398,602,565 people shows a slight negative correlation between the proportion of Salvadorans and poverty level among males in the United States with a correlation coefficient (R) of -0.086 and weighted average of 12.6%, a difference of 10.2%.
Male Poverty Correlation Summary
| Measurement | Hispanic or Latino | Salvadoran |
| Minimum | 9.3% | 2.6% |
| Maximum | 34.6% | 28.2% |
| Range | 25.3% | 25.5% |
| Mean | 14.5% | 12.6% |
| Median | 13.7% | 12.2% |
| Interquartile 25% (IQ1) | 11.3% | 10.5% |
| Interquartile 75% (IQ3) | 16.4% | 14.7% |
| Interquartile Range (IQR) | 5.1% | 4.2% |
| Standard Deviation (Sample) | 4.2% | 4.6% |
| Standard Deviation (Population) | 4.2% | 4.6% |
Similar Demographics by Male Poverty
Demographics Similar to Hispanics or Latinos by Male Poverty
In terms of male poverty, the demographic groups most similar to Hispanics or Latinos are Immigrants from Belize (13.8%, a difference of 0.060%), Indonesian (13.8%, a difference of 0.070%), Vietnamese (13.8%, a difference of 0.24%), Immigrants from Central America (13.9%, a difference of 0.28%), and Immigrants from Zaire (13.8%, a difference of 0.32%).
| Demographics | Rating | Rank | Male Poverty |
| Immigrants | Barbados | 0.0 /100 | #287 | Tragic 13.8% |
| Immigrants | St. Vincent and the Grenadines | 0.0 /100 | #288 | Tragic 13.8% |
| Guatemalans | 0.0 /100 | #289 | Tragic 13.8% |
| Immigrants | Zaire | 0.0 /100 | #290 | Tragic 13.8% |
| Vietnamese | 0.0 /100 | #291 | Tragic 13.8% |
| Indonesians | 0.0 /100 | #292 | Tragic 13.8% |
| Immigrants | Belize | 0.0 /100 | #293 | Tragic 13.8% |
| Hispanics or Latinos | 0.0 /100 | #294 | Tragic 13.9% |
| Immigrants | Central America | 0.0 /100 | #295 | Tragic 13.9% |
| Cajuns | 0.0 /100 | #296 | Tragic 13.9% |
| Inupiat | 0.0 /100 | #297 | Tragic 14.0% |
| Blackfeet | 0.0 /100 | #298 | Tragic 14.0% |
| Immigrants | Guatemala | 0.0 /100 | #299 | Tragic 14.0% |
| Immigrants | Mexico | 0.0 /100 | #300 | Tragic 14.0% |
| Immigrants | Senegal | 0.0 /100 | #301 | Tragic 14.0% |
Demographics Similar to Salvadorans by Male Poverty
In terms of male poverty, the demographic groups most similar to Salvadorans are Nicaraguan (12.6%, a difference of 0.12%), Fijian (12.6%, a difference of 0.16%), Immigrants from Armenia (12.6%, a difference of 0.23%), Marshallese (12.5%, a difference of 0.56%), and Immigrants from Laos (12.6%, a difference of 0.59%).
| Demographics | Rating | Rank | Male Poverty |
| Immigrants | Nigeria | 1.6 /100 | #224 | Tragic 12.3% |
| Osage | 1.5 /100 | #225 | Tragic 12.3% |
| Nigerians | 1.4 /100 | #226 | Tragic 12.3% |
| Alaska Natives | 1.4 /100 | #227 | Tragic 12.4% |
| Alsatians | 1.3 /100 | #228 | Tragic 12.4% |
| Cubans | 1.3 /100 | #229 | Tragic 12.4% |
| Marshallese | 0.8 /100 | #230 | Tragic 12.5% |
| Salvadorans | 0.6 /100 | #231 | Tragic 12.6% |
| Nicaraguans | 0.6 /100 | #232 | Tragic 12.6% |
| Fijians | 0.6 /100 | #233 | Tragic 12.6% |
| Immigrants | Armenia | 0.6 /100 | #234 | Tragic 12.6% |
| Immigrants | Laos | 0.5 /100 | #235 | Tragic 12.6% |
| Immigrants | Saudi Arabia | 0.4 /100 | #236 | Tragic 12.7% |
| French American Indians | 0.4 /100 | #237 | Tragic 12.7% |
| Ecuadorians | 0.4 /100 | #238 | Tragic 12.7% |