Immigrants from Congo vs Panamanian Poverty
COMPARE
Immigrants from Congo
Panamanian
Poverty
Poverty Comparison
Immigrants from Congo
Panamanians
16.1%
POVERTY
0.0/ 100
METRIC RATING
319th/ 347
METRIC RANK
13.1%
POVERTY
6.6/ 100
METRIC RATING
207th/ 347
METRIC RANK
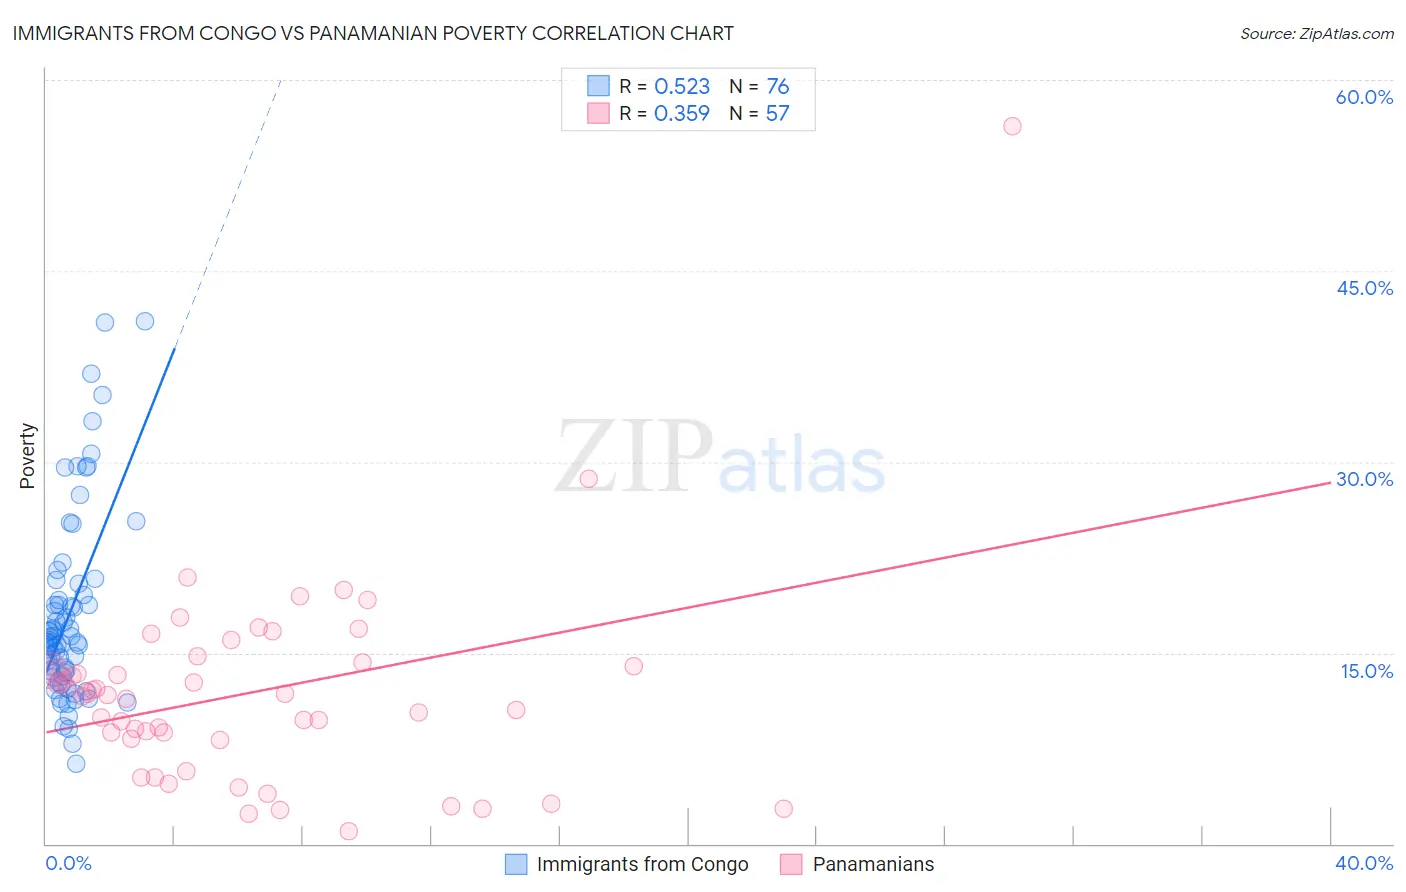
Immigrants from Congo vs Panamanian Poverty Correlation Chart
The statistical analysis conducted on geographies consisting of 92,094,185 people shows a substantial positive correlation between the proportion of Immigrants from Congo and poverty level in the United States with a correlation coefficient (R) of 0.523 and weighted average of 16.1%. Similarly, the statistical analysis conducted on geographies consisting of 281,075,399 people shows a mild positive correlation between the proportion of Panamanians and poverty level in the United States with a correlation coefficient (R) of 0.359 and weighted average of 13.1%, a difference of 23.1%.
Poverty Correlation Summary
| Measurement | Immigrants from Congo | Panamanian |
| Minimum | 6.3% | 0.99% |
| Maximum | 41.0% | 56.4% |
| Range | 34.7% | 55.4% |
| Mean | 18.1% | 11.9% |
| Median | 16.1% | 11.7% |
| Interquartile 25% (IQ1) | 13.3% | 8.2% |
| Interquartile 75% (IQ3) | 20.0% | 14.1% |
| Interquartile Range (IQR) | 6.7% | 5.9% |
| Standard Deviation (Sample) | 7.4% | 8.1% |
| Standard Deviation (Population) | 7.4% | 8.1% |
Similar Demographics by Poverty
Demographics Similar to Immigrants from Congo by Poverty
In terms of poverty, the demographic groups most similar to Immigrants from Congo are Immigrants from Dominica (16.1%, a difference of 0.20%), Immigrants from Honduras (16.2%, a difference of 0.23%), U.S. Virgin Islander (16.1%, a difference of 0.49%), Arapaho (16.3%, a difference of 0.97%), and Honduran (15.9%, a difference of 1.7%).
| Demographics | Rating | Rank | Poverty |
| Cajuns | 0.0 /100 | #312 | Tragic 15.7% |
| Immigrants | Grenada | 0.0 /100 | #313 | Tragic 15.8% |
| Immigrants | Somalia | 0.0 /100 | #314 | Tragic 15.8% |
| British West Indians | 0.0 /100 | #315 | Tragic 15.9% |
| Hondurans | 0.0 /100 | #316 | Tragic 15.9% |
| U.S. Virgin Islanders | 0.0 /100 | #317 | Tragic 16.1% |
| Immigrants | Dominica | 0.0 /100 | #318 | Tragic 16.1% |
| Immigrants | Congo | 0.0 /100 | #319 | Tragic 16.1% |
| Immigrants | Honduras | 0.0 /100 | #320 | Tragic 16.2% |
| Arapaho | 0.0 /100 | #321 | Tragic 16.3% |
| Menominee | 0.0 /100 | #322 | Tragic 16.4% |
| Colville | 0.0 /100 | #323 | Tragic 16.6% |
| Yakama | 0.0 /100 | #324 | Tragic 16.7% |
| Central American Indians | 0.0 /100 | #325 | Tragic 16.7% |
| Paiute | 0.0 /100 | #326 | Tragic 16.7% |
Demographics Similar to Panamanians by Poverty
In terms of poverty, the demographic groups most similar to Panamanians are Immigrants from Eastern Africa (13.1%, a difference of 0.12%), Ugandan (13.1%, a difference of 0.15%), Malaysian (13.1%, a difference of 0.18%), Immigrants from the Azores (13.1%, a difference of 0.21%), and Moroccan (13.2%, a difference of 0.57%).
| Demographics | Rating | Rank | Poverty |
| Spaniards | 16.5 /100 | #200 | Poor 12.8% |
| Immigrants | Uganda | 16.5 /100 | #201 | Poor 12.8% |
| Immigrants | Uruguay | 15.6 /100 | #202 | Poor 12.8% |
| Hmong | 15.0 /100 | #203 | Poor 12.8% |
| Immigrants | Western Asia | 14.1 /100 | #204 | Poor 12.9% |
| Tsimshian | 9.2 /100 | #205 | Tragic 13.0% |
| Immigrants | Eastern Africa | 7.0 /100 | #206 | Tragic 13.1% |
| Panamanians | 6.6 /100 | #207 | Tragic 13.1% |
| Ugandans | 6.2 /100 | #208 | Tragic 13.1% |
| Malaysians | 6.1 /100 | #209 | Tragic 13.1% |
| Immigrants | Azores | 6.1 /100 | #210 | Tragic 13.1% |
| Moroccans | 5.2 /100 | #211 | Tragic 13.2% |
| Immigrants | Immigrants | 4.3 /100 | #212 | Tragic 13.2% |
| Immigrants | Panama | 4.1 /100 | #213 | Tragic 13.3% |
| Bermudans | 3.7 /100 | #214 | Tragic 13.3% |