Bhutanese vs Panamanian Poverty
COMPARE
Bhutanese
Panamanian
Poverty
Poverty Comparison
Bhutanese
Panamanians
10.4%
POVERTY
99.8/ 100
METRIC RATING
12th/ 347
METRIC RANK
13.1%
POVERTY
6.6/ 100
METRIC RATING
207th/ 347
METRIC RANK
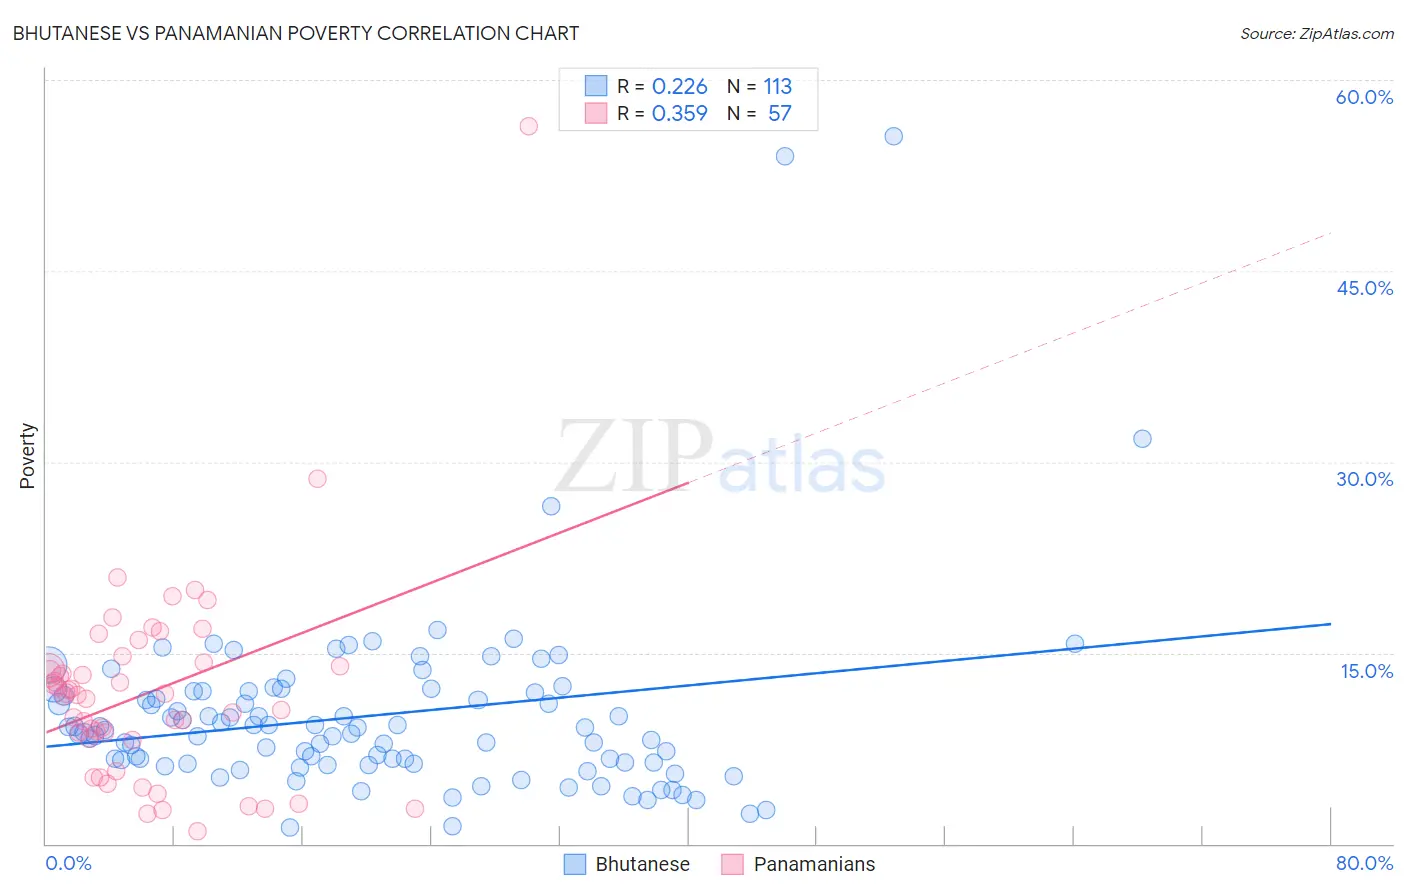
Bhutanese vs Panamanian Poverty Correlation Chart
The statistical analysis conducted on geographies consisting of 455,158,170 people shows a weak positive correlation between the proportion of Bhutanese and poverty level in the United States with a correlation coefficient (R) of 0.226 and weighted average of 10.4%. Similarly, the statistical analysis conducted on geographies consisting of 281,075,399 people shows a mild positive correlation between the proportion of Panamanians and poverty level in the United States with a correlation coefficient (R) of 0.359 and weighted average of 13.1%, a difference of 26.2%.
Poverty Correlation Summary
| Measurement | Bhutanese | Panamanian |
| Minimum | 1.3% | 0.99% |
| Maximum | 55.6% | 56.4% |
| Range | 54.3% | 55.4% |
| Mean | 10.1% | 11.9% |
| Median | 9.0% | 11.7% |
| Interquartile 25% (IQ1) | 6.3% | 8.2% |
| Interquartile 75% (IQ3) | 12.0% | 14.1% |
| Interquartile Range (IQR) | 5.6% | 5.9% |
| Standard Deviation (Sample) | 7.5% | 8.1% |
| Standard Deviation (Population) | 7.5% | 8.1% |
Similar Demographics by Poverty
Demographics Similar to Bhutanese by Poverty
In terms of poverty, the demographic groups most similar to Bhutanese are Immigrants from Hong Kong (10.4%, a difference of 0.22%), Immigrants from Lithuania (10.3%, a difference of 0.35%), Immigrants from Bolivia (10.4%, a difference of 0.53%), Bolivian (10.4%, a difference of 0.54%), and Lithuanian (10.5%, a difference of 0.84%).
| Demographics | Rating | Rank | Poverty |
| Immigrants | Ireland | 99.9 /100 | #5 | Exceptional 10.1% |
| Assyrians/Chaldeans/Syriacs | 99.9 /100 | #6 | Exceptional 10.1% |
| Filipinos | 99.9 /100 | #7 | Exceptional 10.1% |
| Maltese | 99.9 /100 | #8 | Exceptional 10.2% |
| Immigrants | South Central Asia | 99.9 /100 | #9 | Exceptional 10.2% |
| Bulgarians | 99.9 /100 | #10 | Exceptional 10.2% |
| Immigrants | Lithuania | 99.9 /100 | #11 | Exceptional 10.3% |
| Bhutanese | 99.8 /100 | #12 | Exceptional 10.4% |
| Immigrants | Hong Kong | 99.8 /100 | #13 | Exceptional 10.4% |
| Immigrants | Bolivia | 99.8 /100 | #14 | Exceptional 10.4% |
| Bolivians | 99.8 /100 | #15 | Exceptional 10.4% |
| Lithuanians | 99.8 /100 | #16 | Exceptional 10.5% |
| Norwegians | 99.8 /100 | #17 | Exceptional 10.5% |
| Latvians | 99.8 /100 | #18 | Exceptional 10.5% |
| Immigrants | Scotland | 99.7 /100 | #19 | Exceptional 10.6% |
Demographics Similar to Panamanians by Poverty
In terms of poverty, the demographic groups most similar to Panamanians are Immigrants from Eastern Africa (13.1%, a difference of 0.12%), Ugandan (13.1%, a difference of 0.15%), Malaysian (13.1%, a difference of 0.18%), Immigrants from the Azores (13.1%, a difference of 0.21%), and Moroccan (13.2%, a difference of 0.57%).
| Demographics | Rating | Rank | Poverty |
| Spaniards | 16.5 /100 | #200 | Poor 12.8% |
| Immigrants | Uganda | 16.5 /100 | #201 | Poor 12.8% |
| Immigrants | Uruguay | 15.6 /100 | #202 | Poor 12.8% |
| Hmong | 15.0 /100 | #203 | Poor 12.8% |
| Immigrants | Western Asia | 14.1 /100 | #204 | Poor 12.9% |
| Tsimshian | 9.2 /100 | #205 | Tragic 13.0% |
| Immigrants | Eastern Africa | 7.0 /100 | #206 | Tragic 13.1% |
| Panamanians | 6.6 /100 | #207 | Tragic 13.1% |
| Ugandans | 6.2 /100 | #208 | Tragic 13.1% |
| Malaysians | 6.1 /100 | #209 | Tragic 13.1% |
| Immigrants | Azores | 6.1 /100 | #210 | Tragic 13.1% |
| Moroccans | 5.2 /100 | #211 | Tragic 13.2% |
| Immigrants | Immigrants | 4.3 /100 | #212 | Tragic 13.2% |
| Immigrants | Panama | 4.1 /100 | #213 | Tragic 13.3% |
| Bermudans | 3.7 /100 | #214 | Tragic 13.3% |